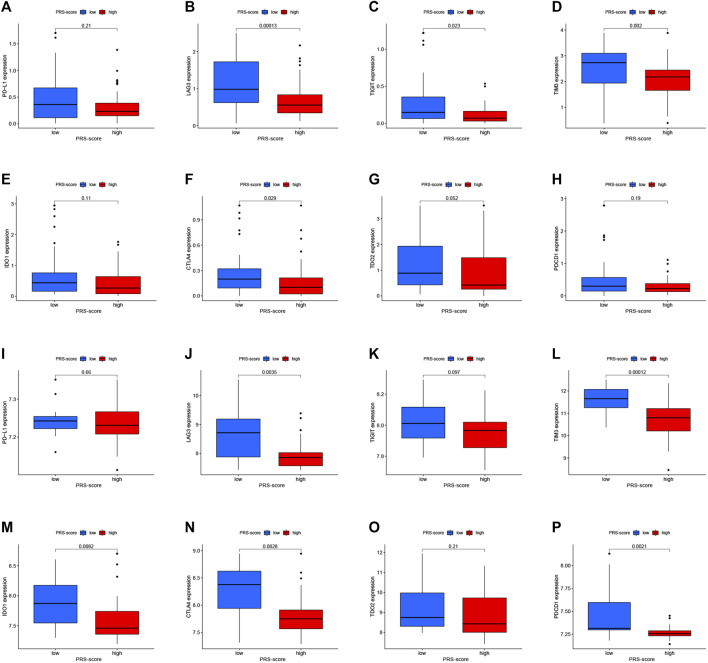
FIGURE 9.
Immune checkpoint molecules expression analysis. (A–H) The expression levels of Immune checkpoint molecules, including PD-L1 (A), LAG-3 (B), TIGIT (C), TIM-3 (D), IDO1 (E), CTLA-4 (F), TDO2 (G), and PDCD1 (H) between high and low PRS-score groups in the TARGET cohort. (I–P) The expression levels of Immune checkpoint molecules, including PD-L1 (I), LAG-3 (J), TIGIT (K), TIM-3 (L), IDO1 (M), CTLA-4 (N), TDO2 (O), and PDCD1 (P) between high and low PRS-score groups in the GEO cohort.

