
Figure 3. Correlations between Hedge’s g effect sizes for metabolite concentrations and Mini-Mental State Exam (MMSE) scores in the hippocampus of MCI/AD patients.
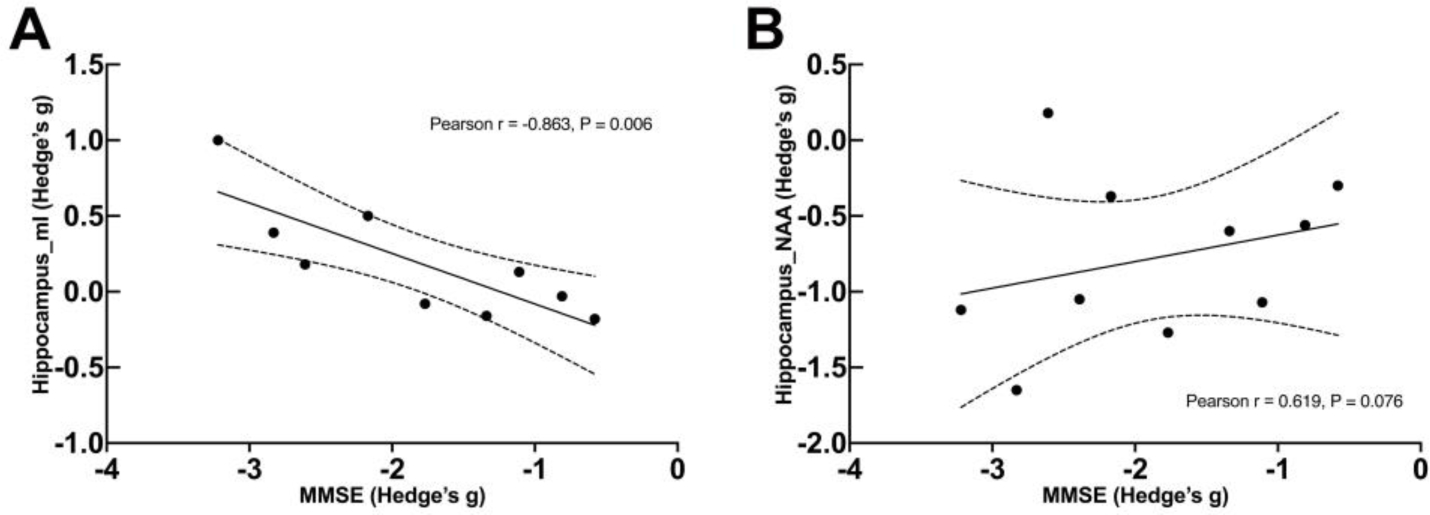
Panel (A) depicts the correlations between Hedge’s g for myo-inositol (mI) and MMSE scores. Panel (B) depicts the correlations between Hedge’s g for N-acetyl aspartate (NAA) and MMSE scores.