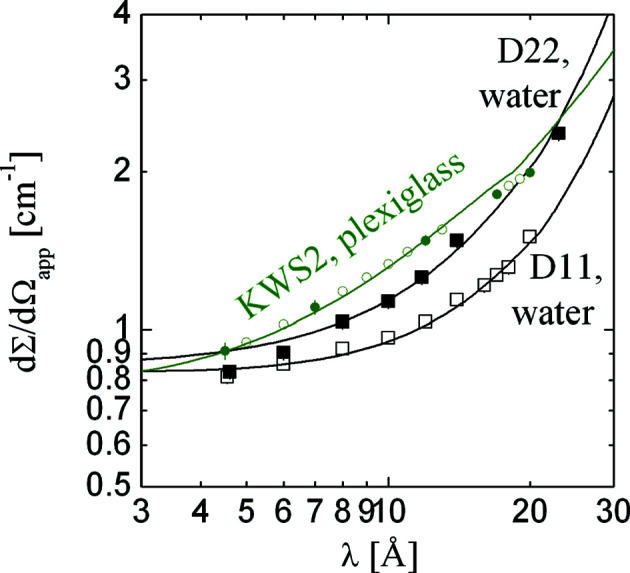
Figure 3.

The calibrated apparent small-angle scattering macroscopic differential cross sections of water (1 mm thickness) and plexiglass (1.5 mm), measured and simulated. The black data points arise from water measurements on the instruments D11 and D22 at the Institut Laue–Langevin (ILL) (Lindner, 2000 ▸). The solid green data points arise from plexiglass measurements on the instrument KWS2 at FRM2 (internal communication). The open dots are interpolated for calibration use. The error bars are either clearly indicated or similar to the symbol size. The solid lines are simulated using equations (1)–(6) .
