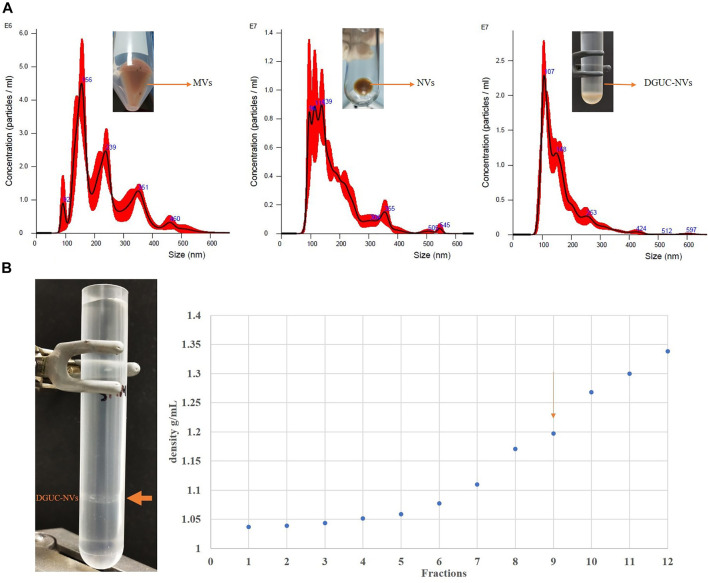
FIGURE 1.
(A) Nanoparticle tracking analysis showing the size distribution of microvesicles (MVs), nanovesicles (NVs), and the sucrose density gradient purified nanovesicle fraction (DGUC-NVs). Particle numbers, mean diameter values, and standard deviations are reported in Table 1. (B) The pictures on the left show the sample of strawberry-derived NVs after iodixanol density gradient ultracentrifugation (DGUC). After DGUC, a single visible band could be observed (orange arrow). The densities measured in the 12 different fractions from top to bottom are shown in the chart on the right. The visible band was observed in fraction 9. The vesicles floating in fraction nine are similar in density to mammalian extracellular vesicles, which have a density of 1.13–1.19 g/ ml (Konoshenko et al., 2018).

