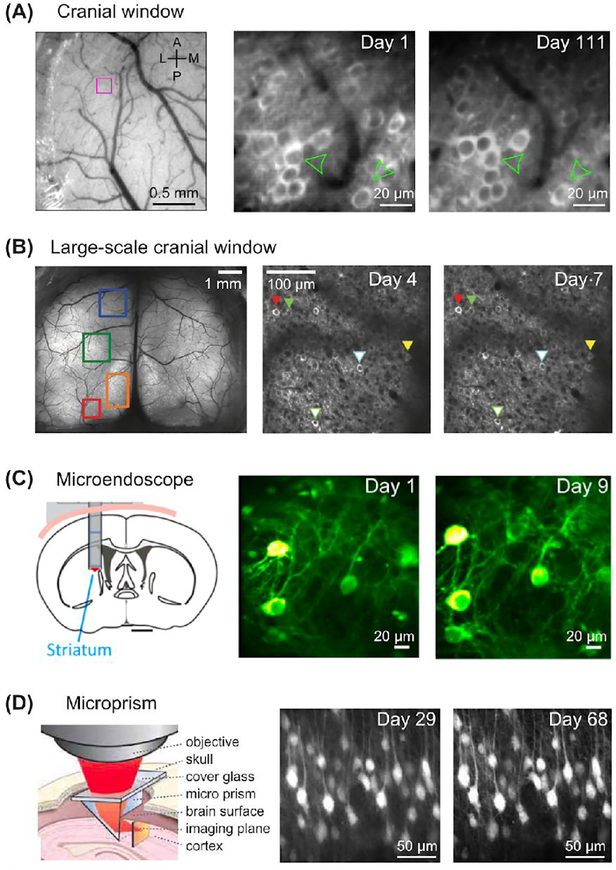
Figure 1.
Chronic imaging approaches for tracking neuronal activity using two-photon imaging of genetically encoded calcium indicators (GECIs). A. Left: Top view of the cerebral cortex through a cranial window implanted above the dura mater. Right: layer 2/3 cortical neurons expressing YC3.60 followed over 111 days. Adapted from Margolis, Lütcke et al. (2012) (Margolis et al 2012). B. Left: Top view of cortex through a large-scale “Crystal Skull” cranial window. Right: Chronic imaging of one of many optically accessible cortical neuronal populations expressing GCaMP6s. Adapted from Kim et al. (2016) (Kim et al. 2016). C. Left: Deep brain structures can be imaged through an implanted GRIN lens. Right: Neurons in striatum expressing GCaMP6s. Note that neurons were followed for a longer time period than shown here. Adapted from Bocarsly, Jiang et al. (2015) (Bocarsly et al. 2015). D. Left: Axially oriented brain structures can be imaged through a prism implanted facing the side of the area of interest. A microprism can also be used for deeper brain structures. Right: Neurons in neocortex expressing GCaMP3 imaged over multiple weeks. Apical dendrites are visible in the x-z plane. Note that the original image was cropped for display. Adapted from Andermann et al. (2013) (Andermann et al. 2013).

