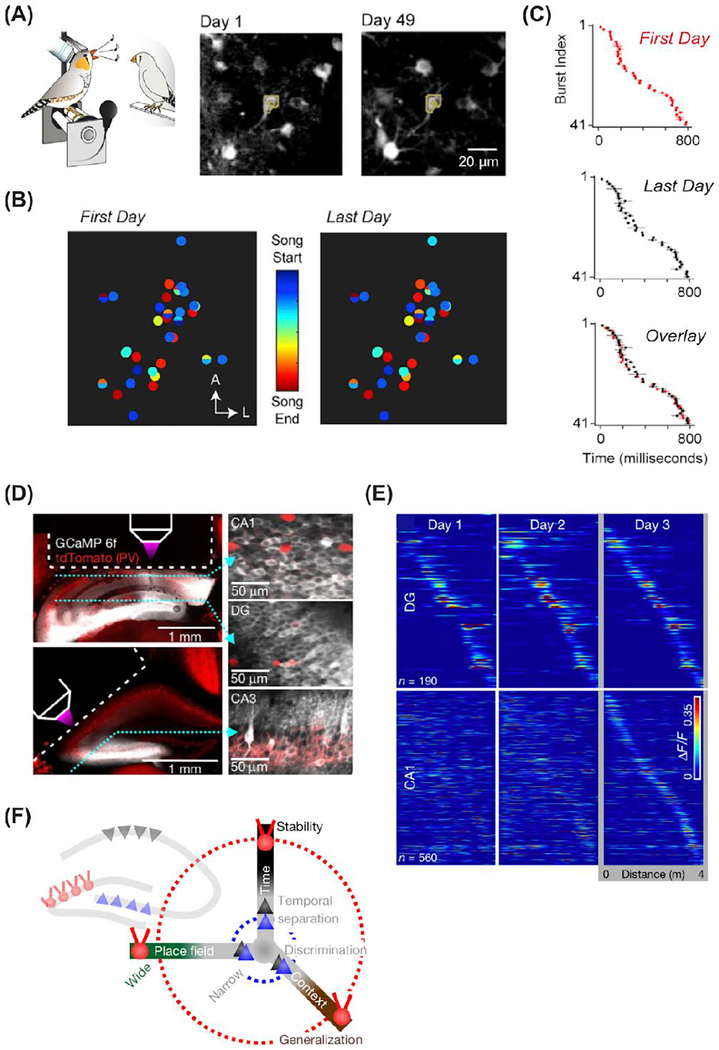
Figure 2.
Stability and flexibility of behavior-related neuronal population activity measured with chronic imaging. A. Example of stability in songbird experiment. Two-photon images of neurons expressing GCaMP6f tracked over 49 days. B. Comparison of song timing maps for a population of neurons. C. Stability of burst index measures. A-C adapted from Katlowitz et al. (2018) (Katlowitz et al. 2018). D. Subregion-specific stability in hippocampus. Chronic imaging of CA1, DG, and CA3 sub-regions. E. Heat maps of neuronal calcium signals across three days showing higher stability for DG than CA1. F. Schematic of differences in stability, width, and generalization for CA1, DG, and CA3. D-E adapted from Hainmueller and Bartos (2018) (Hainmueller and Bartos 2018).

