
Fig. 5.
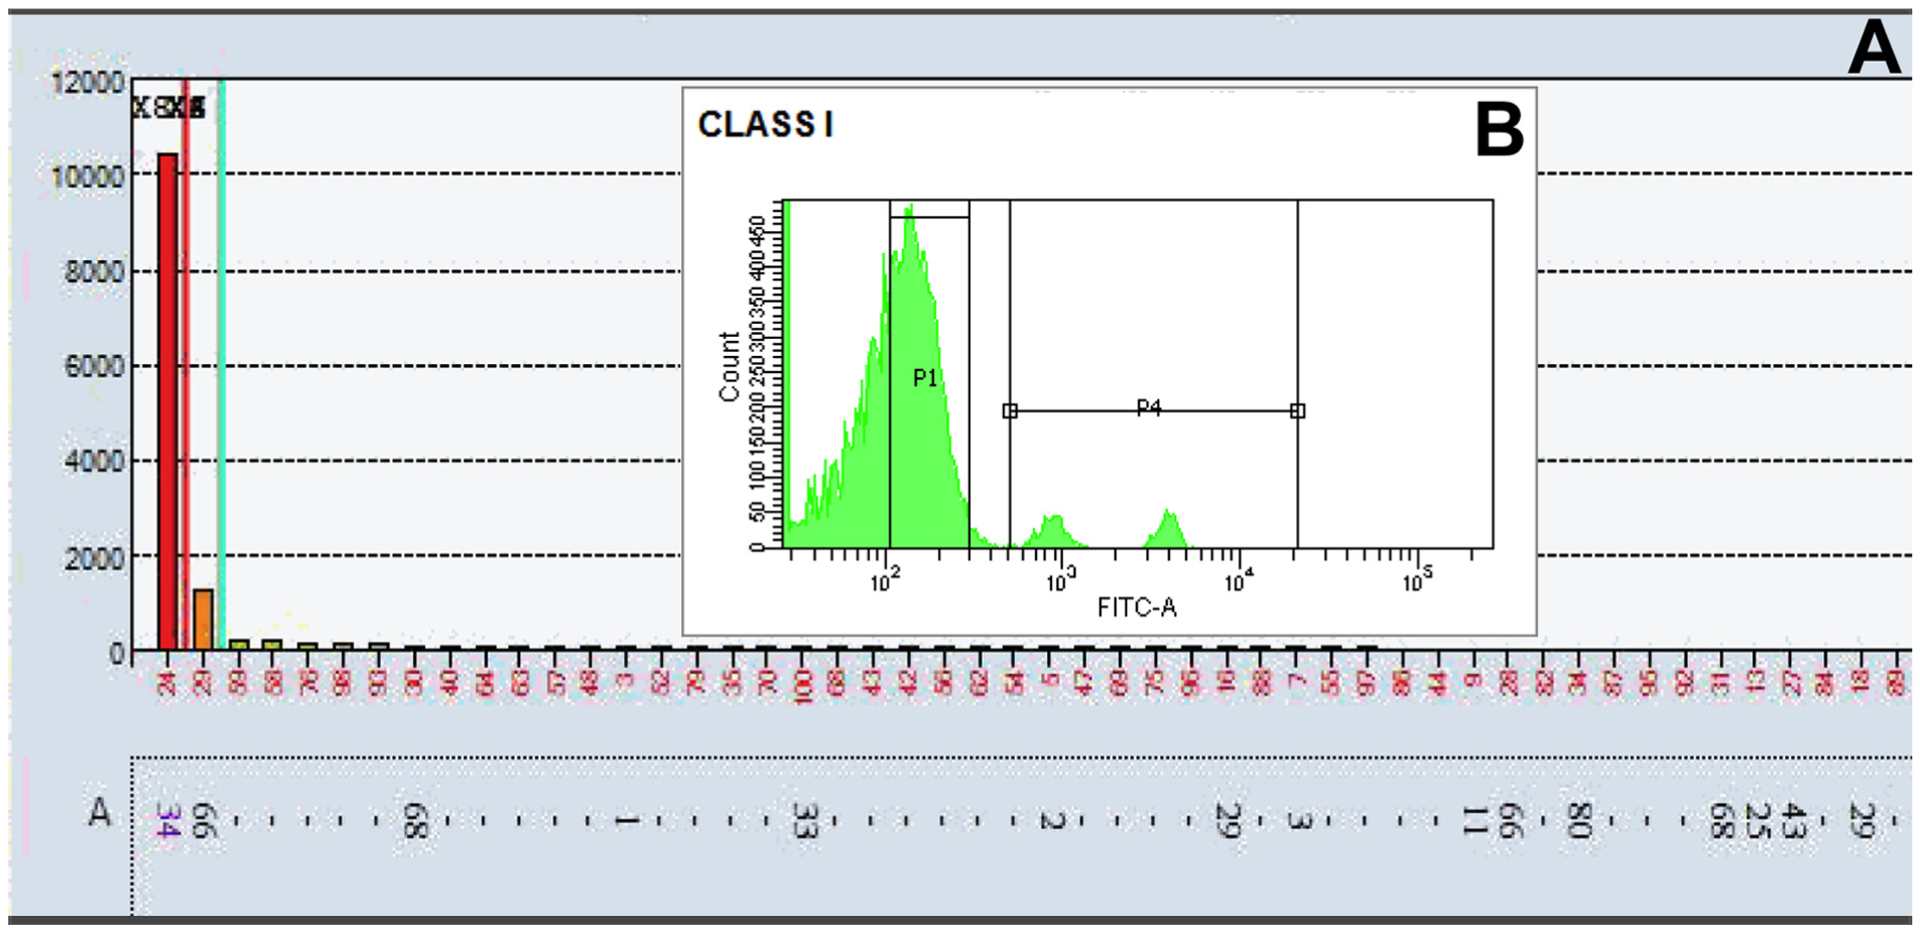
(A) LabScreen® single antigen bead assay: Patient serum demonstrating an antibody to A34 (A*34:01) with an MFI ~10,000 (B) Corresponding cytometric histogram of Class I FlowPRA®: Patient serum shows two distinct peaks, which likely represent an example of the gene-dosage effect with the first peak representing a bead that is heterozygous for A*34:01 and the second peak representing a bead that is homozygous for A*34:01.