Fig. 3.

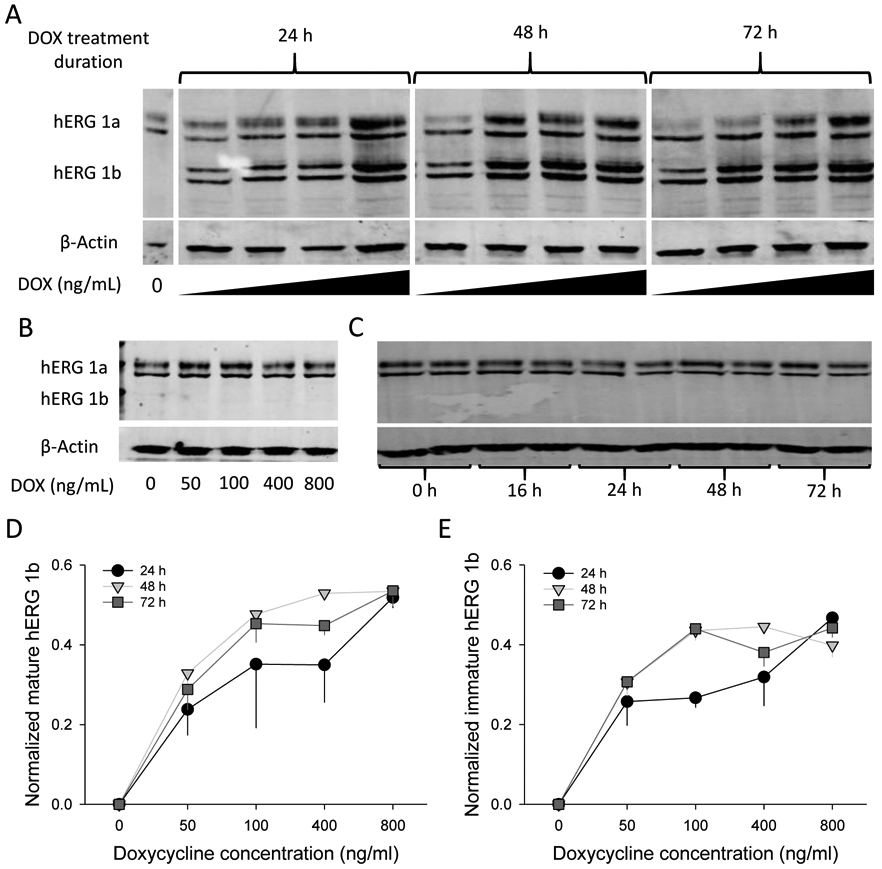
hERG1b inducible expression is DOX dose dependent. A) Representative blot of cells treated with increasing concentrations of DOX for 0, 24, 48, and 72 h. Both mature and immature bands are revealed for hERG1a (upper bands) and hERG1b (lower bands). Beta-actin was used as a loading control. DOX concentrations used for the experiments were 0, 50, 100, 400 and 800 ng/ml, from left to right, corresponding to each lane. B) Representative blot from hERG1a stable cell line treated with different concentrations of DOX for 24h to investigate the effects of DOX on hERG1a expression alone. C) Representative blot of hERG1a/1b cell line kept under culture conditions without DOX treatment and analyzed at different time points to determine if any “leak” expression was present. D and E) Quantification of mature and immature hERG1b, respectively after 24, 48 and 72 h treatment with DOX. hERG1b mature and immature bands were normalized to maximal hERG1b total signal for each independent blot (mature + immature signals). β-actin was used a loading control and no significant differences between lanes were observed for its signal intensity. N = 4.
