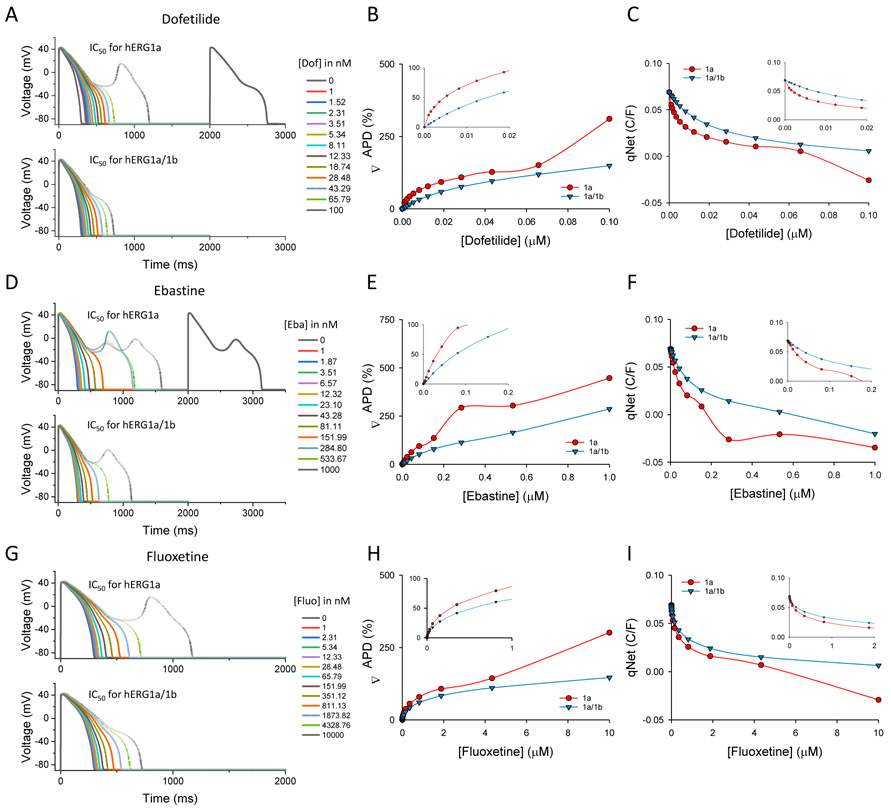
Figure 8.
Comparison of pro-arrhythmic parameters using IC50 values from hERG1a versus hERG1a/1b cells. Simulations were done using the web ActionPotential Portal application by introducing IC50 values determined in hERG1a (red) or hERG1a/1b cells (blue) for each drug at physiological temperature (see Methods for details). A) Action potential simulations with increasing concentrations of dofetilide. B) Changes in the action potential duration (ΔAPD) in percentage estimated with different concentrations of dofetilide. Insert, amplification for lower concentrations of dofetilide. C) qNet changes during the action potential at different concentrations of dofetilide. Insert, amplification for lower concentrations of dofetilide. D) Action potential simulations with increasing concentrations of ebastine. E) Changes in the action potential duration (ΔAPD) in percentage estimated with different concentrations of ebastine. Insert, amplification for lower concentrations of ebastine. F) qNet changes during the action potential at different concentrations of ebastine. Insert, amplification for lower concentrations of ebastine. G) Action potential simulations with increasing concentrations of fluoxetine. H) Changes in the action potential duration (ΔAPD) in percentage estimated with different concentrations of fluoxetine. Insert, amplification for lower concentrations of fluoxetine. I) qNet changes during the action potential at different concentrations of fluoxetine. Insert, amplification for lower concentrations of fluoxetine.

