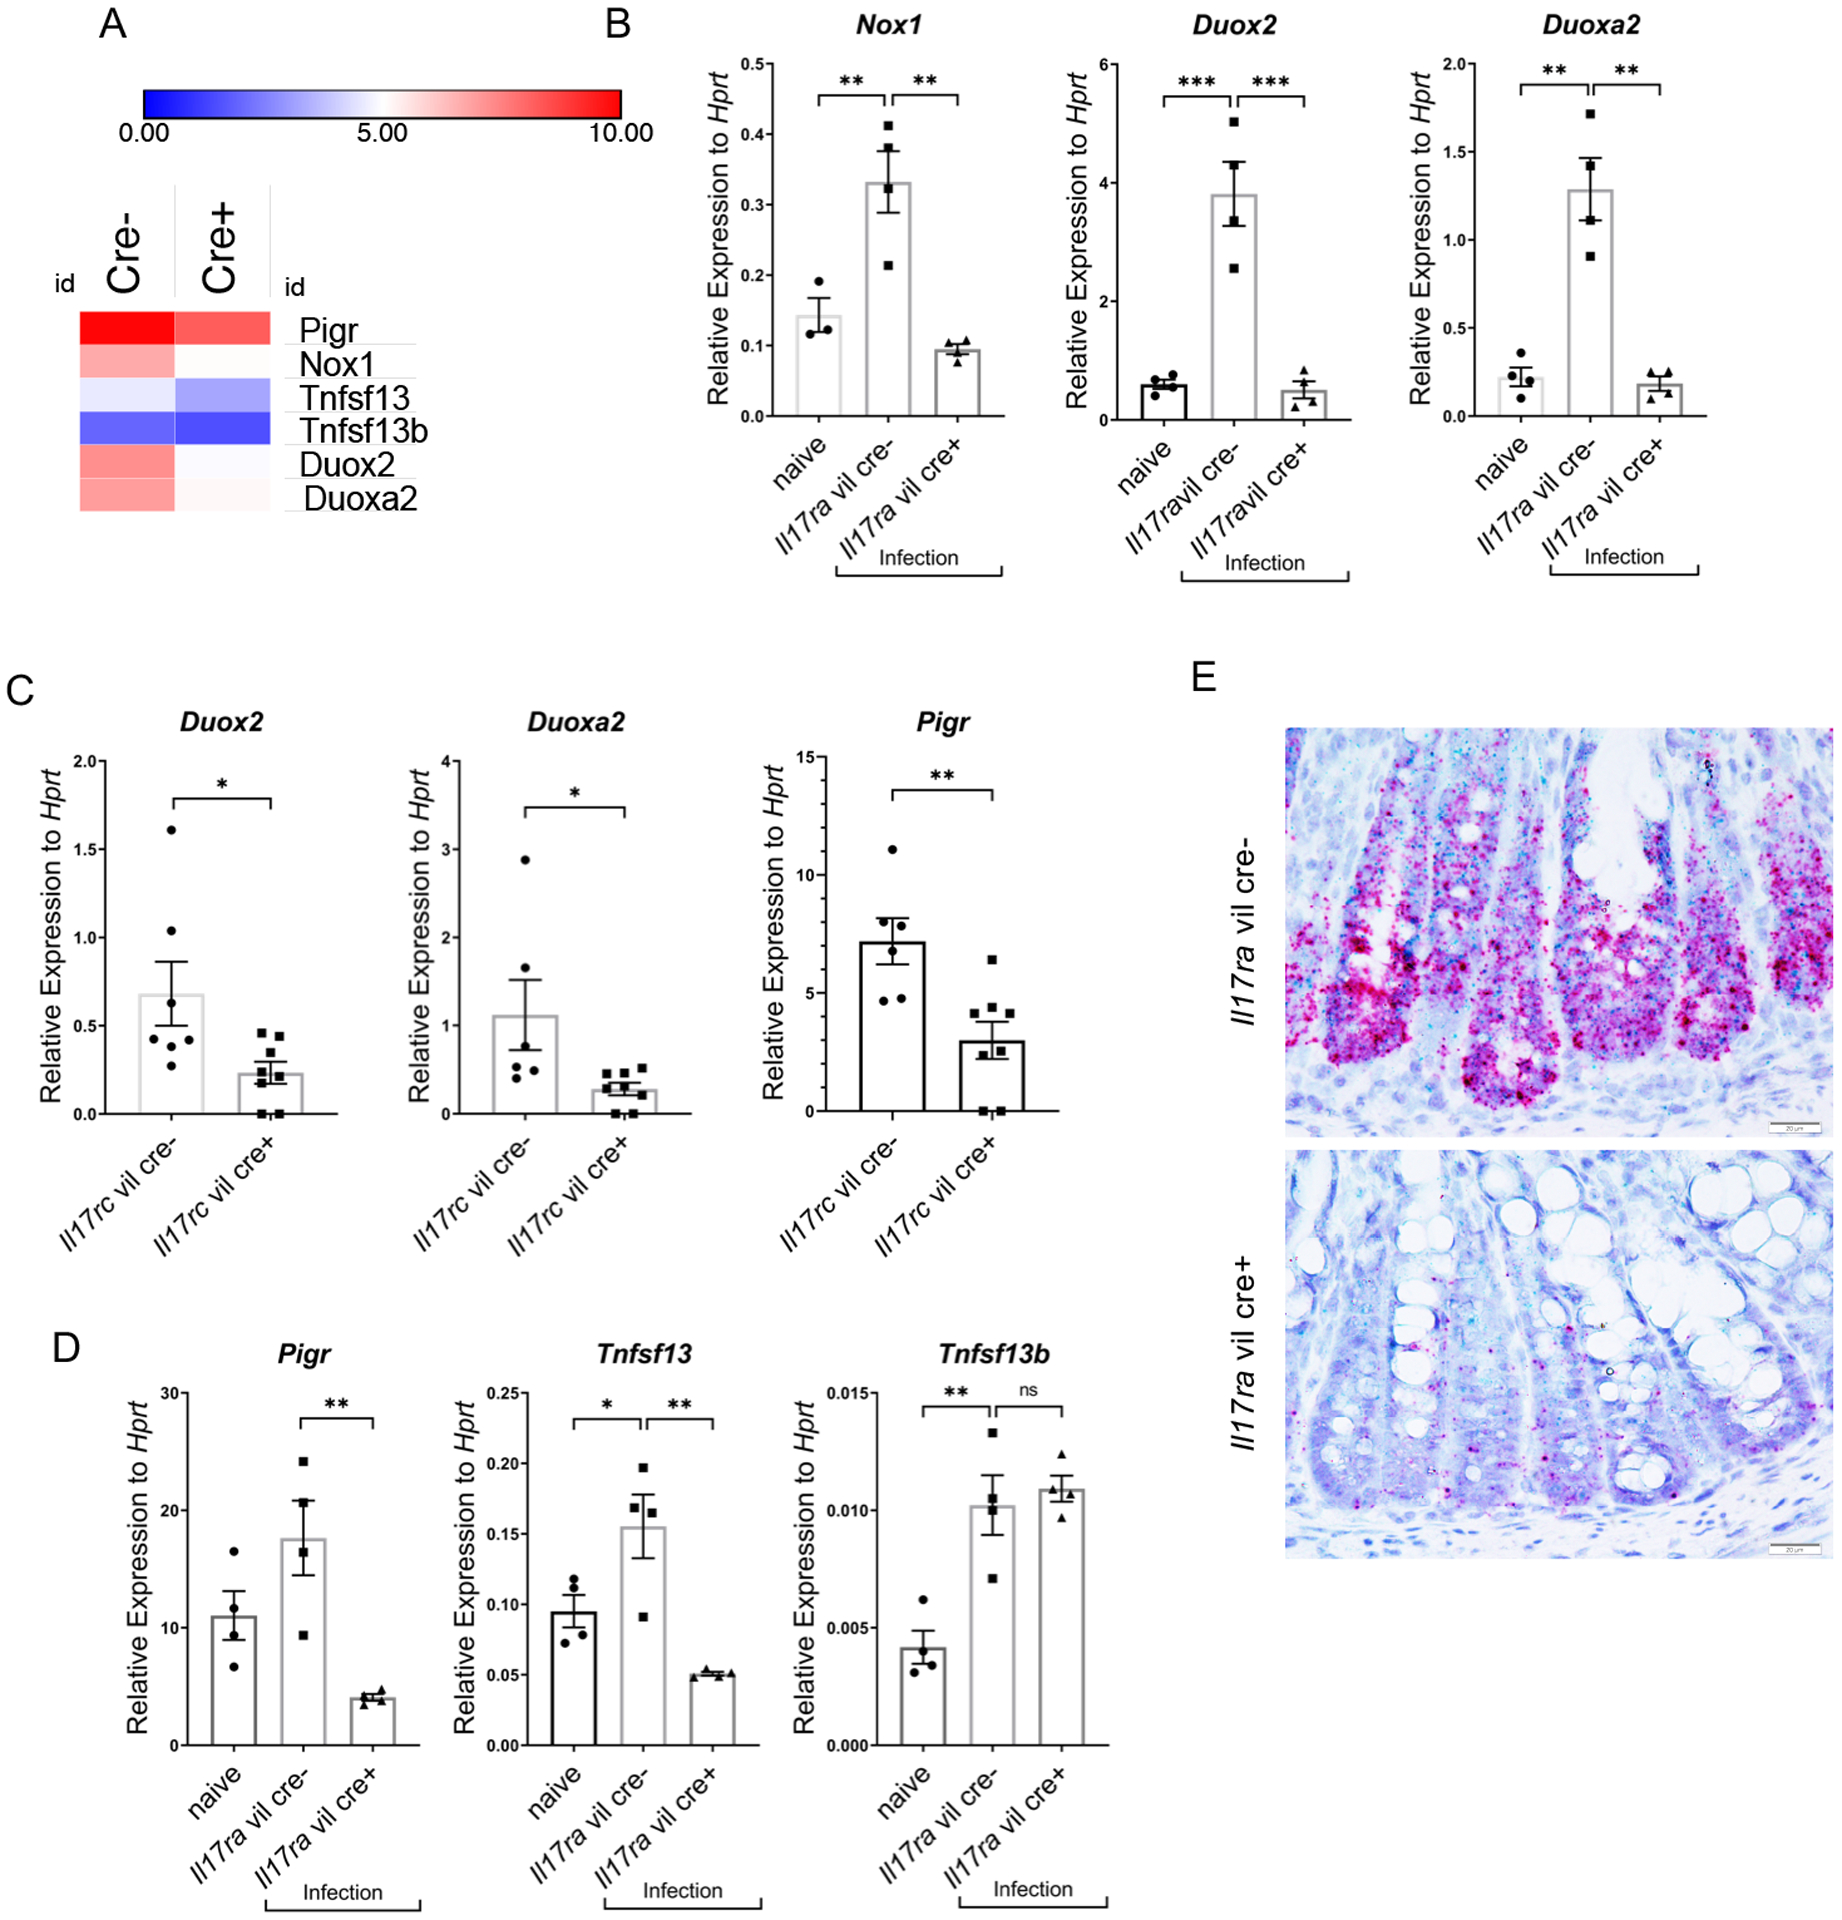
Figure 2. Nox1, Duox2, Duoxa2, Pigr and Tnfsf13 are downregulated in IL-17 receptor deficient mice.

(A) Heat map of RNA-seq data in colon of differentially expressed in genes in colon tissue from Il17ra fl/fl villin Cre+ vs villin Cre- mice (n=3 each group) day 10 after C. rodentium infection. (B) Gene expression of Nox1, Duox2, and Duoxa2, by RT-PCR in colonic epithelial cells of Il17rafl/fl villin Cre+ vs villin Cre- mice day 14 post C. rodentium infection (n=3–4, two independent experiments). Naïve mice were uninfected Il17rafl/fl villin cre- mice. (C) Gene expression of Duox2, Duoxa2, and Pigr, as measured by RT-PCR from Il17rcfl/fl villin cre+ and littermate cre- mice, day 10 day post C. rodentium inoculation. (n=4). Significant differences are designated by 2-tailed Student’s t test. (D) Gene expression of Pigr, Tnfsf13 and Tnfsf13b in the colonic epithelial cells of Il17ra fl/fl villin Cre+ vs villin Cre- mice as measured by RT-PCR, day 14 post C. rodentium infection (n=3–4, two independent experiments). (E) RNAscope of Nox1 and Tnfsf13 mRNA expression in the colon of Il17rafl/fl villin cre+ (n = 4) and littermate control cre- (n = 4) mice 14 days after C. rodentium infection. Red deposits show Nox1 mRNA and green deposits show Tnfsf13 mRNA. Significant differences are designated by using ANOVA followed by Tukey’s multiple comparisons test (B and D). ns, non-significant difference; *, P < 0.05; **, P < 0.01; ***, P < 0.001. Values are means ± SEM.
