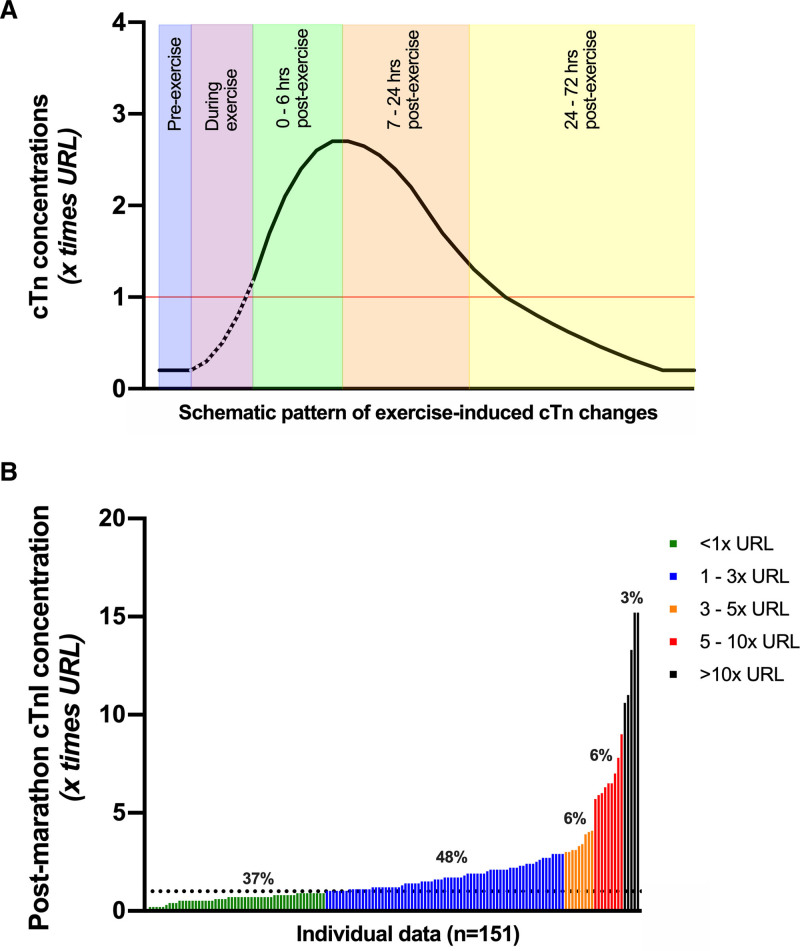
Figure 3.
Proposed pattern of exercise-induced elevations of cTn concentrations. A, Schematic illustration of the kinetics of cTn concentrations after a bout of endurance exercise. Changes of cTn concentrations during exercise are unclear (dashed line), but cumulative data show that cTn concentrations continue to rise after exercise cessation, with peak values reached between 2 and 6 hours after exercise. Complete normalization occurs within 24 to 72 hours after exercise. The 99th percentile or upper reference limit of normal (URL) is shown in red. B, Waterfall plot of individual (n=151) postmarathon cTnI concentrations, highlighting the large interindividual variation across athletes performing a similar endurance exercise bout. Data are pooled from participants of the Boston37 and Eindhoven26 marathons. Values in both plots are expressed as a multiple of the URL of the cTn assay. cTn indicates cardiac troponin.

