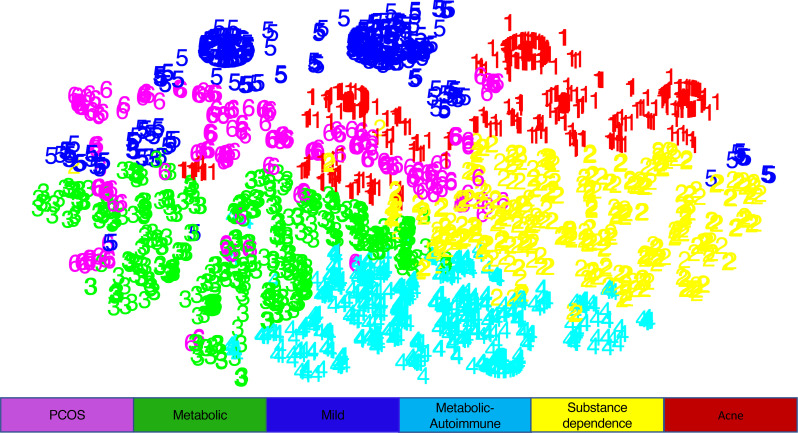
Figure 3. Patient clustering by comorbidity profile as visualized by t-SNE.
K-means clustering was performed for 13,667 patients to create patient clusters, followed by dimensionality reduction and visualization with T-distributed stochastic neighbor embedding (t-SNE). This produced 6 clusters, which were named according to the defining comorbidities.

