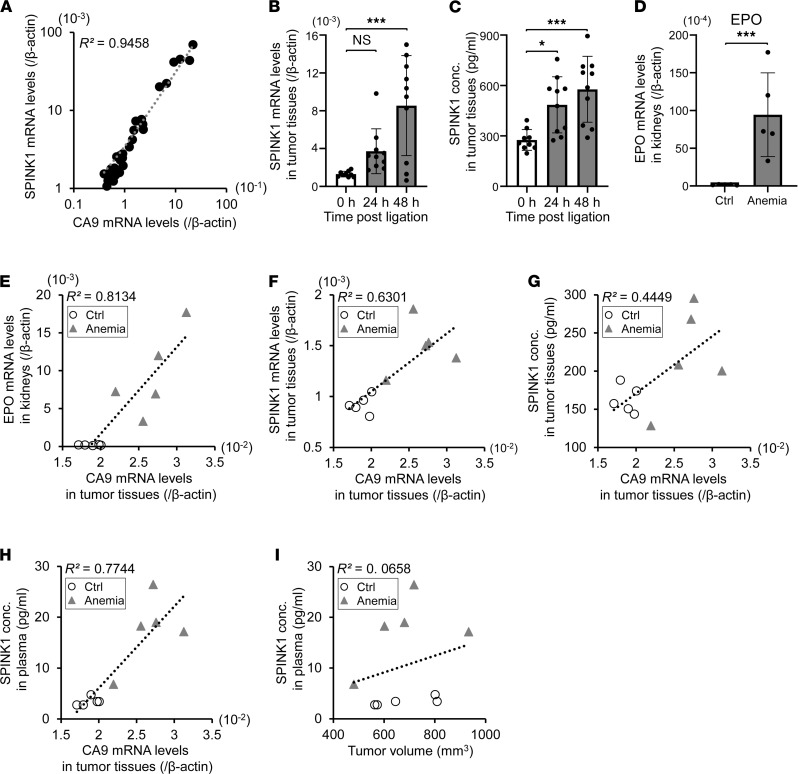
Figure 8. SPINK1 in plasma reflects the degree of hypoxia within tumor tissue in vivo.
(A) A scatter plot for correlation analysis between mRNA levels of SPINK1 and CA9 in 36 HeLa tumor xenografts showed a good coefficient of determination, R2 = 0.9458. (B and C) After blood flow to the HeLa tumor xenografts was decreased by ligaturing the leg for the indicated times, levels of SPINK1 mRNA (B) and SPINK1 protein (C) in the tumor tissues were quantified by qPCR and the ELISA assay, respectively. (D–I) After anemia treatment by phenylhydrazine administration, mRNA levels of EPO in the kidneys (D and E) and those of CA9 (E–H) and SPINK1 (F) in tumor tissues were quantified by qPCR. SPINK1 protein levels in tumors (G) and plasma (H and I) and the tumor volume (I) were measured by the ELISA assay and digital calipers, respectively. Scatter plots for correlation analysis between the 2 indicated factors (E–I). Data are represented as mean ± SD (B–D; n = 36 in A, n = 9–10 in B and C, n = 5 in D–I). Two-tailed Student’s t test (D). One-way ANOVA with Dunnett’s test (B and C). *P < 0.05, ***P < 0.001. SPINK1, serine peptidase inhibitor Kazal type 1; EV, empty vector; CA9, carbonic anhydrase 9; EPO, erythropoietin.

