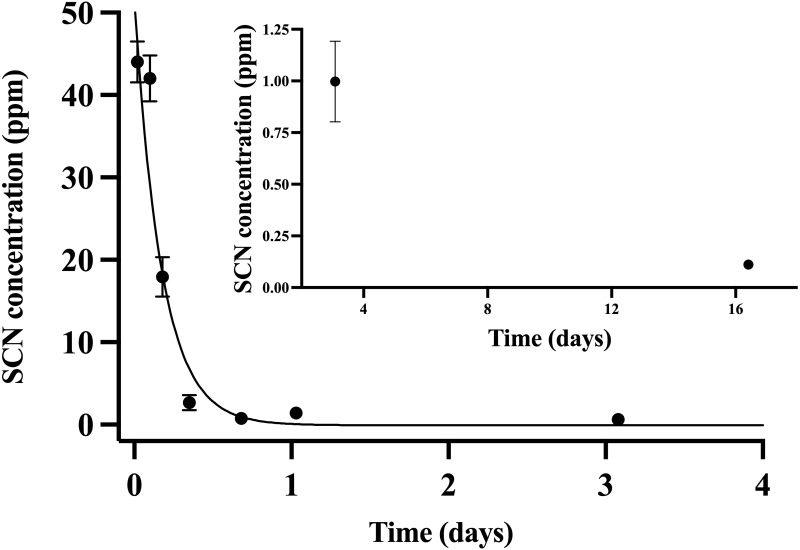
Figure 2. The SCN blood plasma concentration during depuration for Amphiprion clarkii after exposure to 100 ppm SCN for 12 days.
The black solid line represents the fit of the data to a single-phase exponential decay function. Each data point indicates the mean ± S.E. Where no error bar is observed the error is smaller than the data point. Inset shows later time points.

