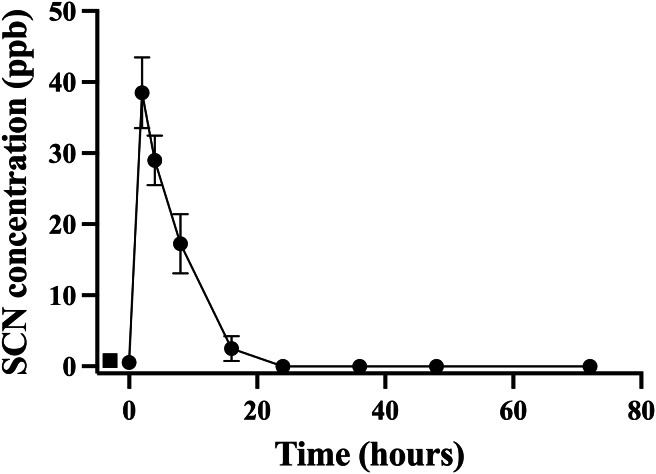
Figure 3. The average (n = 10) concentration of SCN detected in 0.5 L of holding water containing a single Amphiprion clarkii depurating for 72 hrs after exposure to 100 ppm SCN for 12 days.
The data points indicate the mean ± S. E of the SCN concentration in the holding water. Circles are samples once depuration had begun; the square indicates the measured concentration of SCN in the holding water just prior to the addition of the fish. Where no error bar is observed the error is smaller than the data point.

