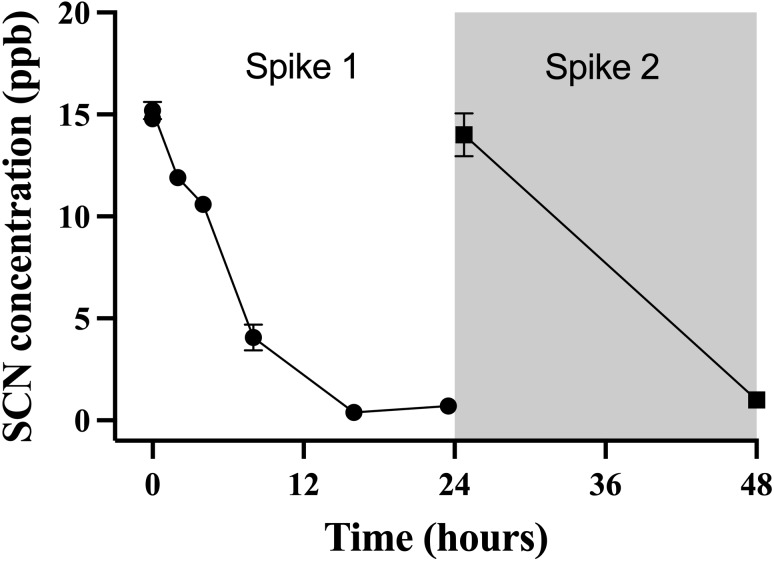
Figure 4. The average (n = 10) concentration of SCN detected in 0.5 L of holding water spiked with SCN containing 1 non-exposed Amphiprion clarkii.
Each data point indicates the mean ± S. E. Where no error bar is observed the error is smaller than the data point. The round data points indicate the data collected after the initial SCN spike (t = 0). The square data points indicate the data after a water change at 24 hrs followed by a second spike.

