Figure 4.

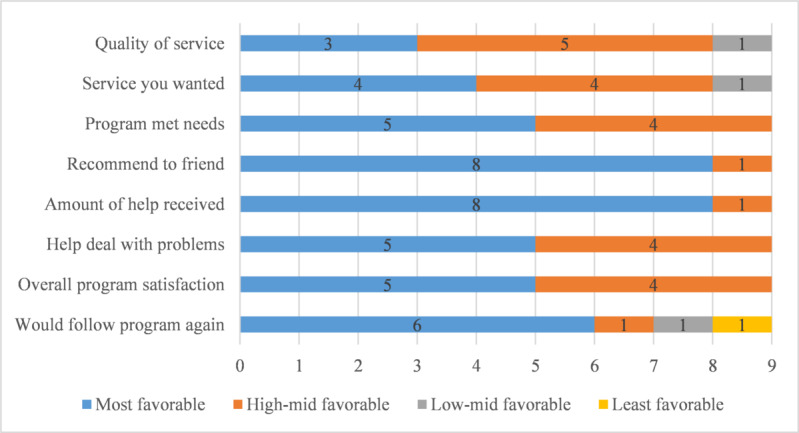
Distribution of each item of the Client Satisfaction Questionnaire-8 (n=9). Data are presented as the number of participants who provided a certain answer to each question.

Distribution of each item of the Client Satisfaction Questionnaire-8 (n=9). Data are presented as the number of participants who provided a certain answer to each question.