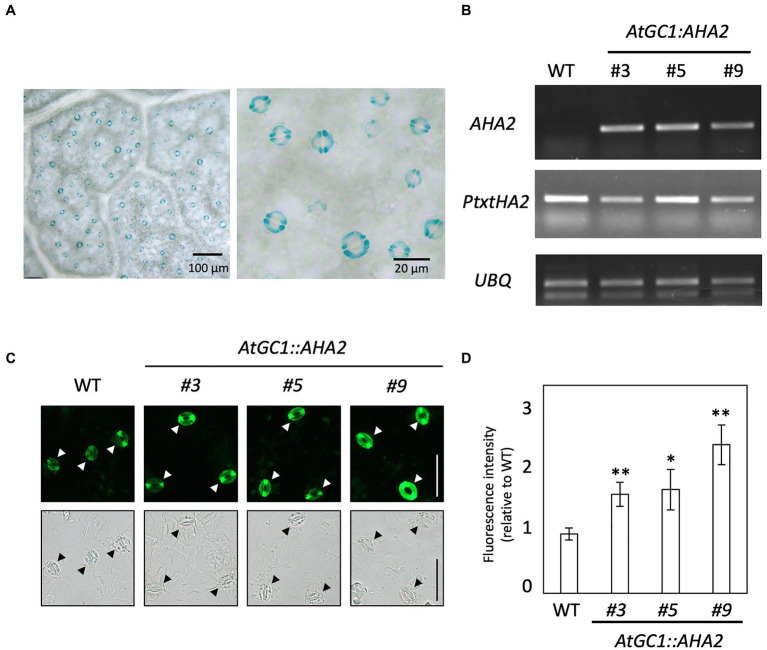
Figure 2.
Promoter activity of AtGC1 in hybrid aspen and generation of AtGC1::AHA2 transgenic hybrid aspens. (A) Histochemical GUS analysis of AtGC1::GUS transgenic hybrid aspens. Images are of the abaxial side of the leaf. A high-magnification image is shown in the right panel. Scale bar=100μm (left panel) and 20μm (right panel). (B) Expression level of AHA2 and P. tremula×P. tremuloides (Pt×t) H+-ATPase in transgenic hybrid aspens and wild type (WT). The expression of AHA2 and Pt × tHA2 was analysed by reverse transcription PCR. Ubiquitin 11 (UBQ, Takata et al., 2009) was used as the internal control. (C) Immunohistochemical analysis of PM H+-ATPase in guard cells of transgenic hybrid aspens and WT. Isolated abaxial leaf epidermis was immunolabeled with antiserum raised against the catalytic domain of AHA2. Fluorescence (upper panel) and bright-field images (lower panel) were captured by a fluorescence microscope. Arrowheads indicate guard cells. Scale bar=50μm. (D) Immunofluorescence intensity in guard cells of transgenic hybrid aspens and WT. Fluorescence intensities in transgenic plants were normalised to those in WT plants. Data are means±SD of three independent measurements. Asterisks denote a mean significantly higher than the WT (set to 1.0; Student’s t test followed by the Benjamini and Hochberg multiple test correction; **p<0.01 and *p<0.05).

