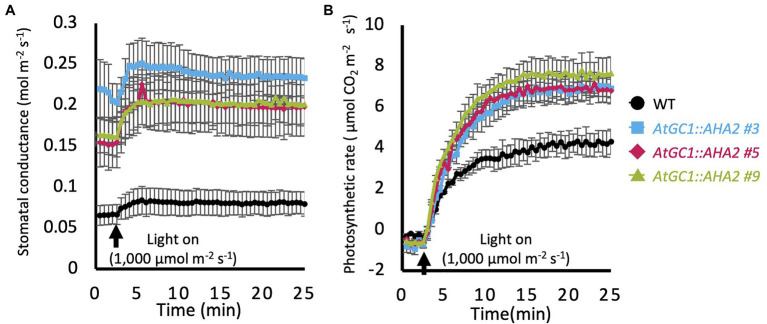
Figure 3.
Gas exchange properties of AtGC1::AHA2 transgenic and wild-type (WT) plants. (A) Light responses of stomatal conductance and (B) the photosynthetic rate in transgenic and WT plants. Measurements were conducted under dark conditions followed by 1,000μmol.m−2.s−1 light. Black arrows indicate the time of light-on. Data were plotted every 30s. Measurements were conducted on three different plants for each transgenic event. Error bars represent SE and are not shown if smaller than the symbols.

