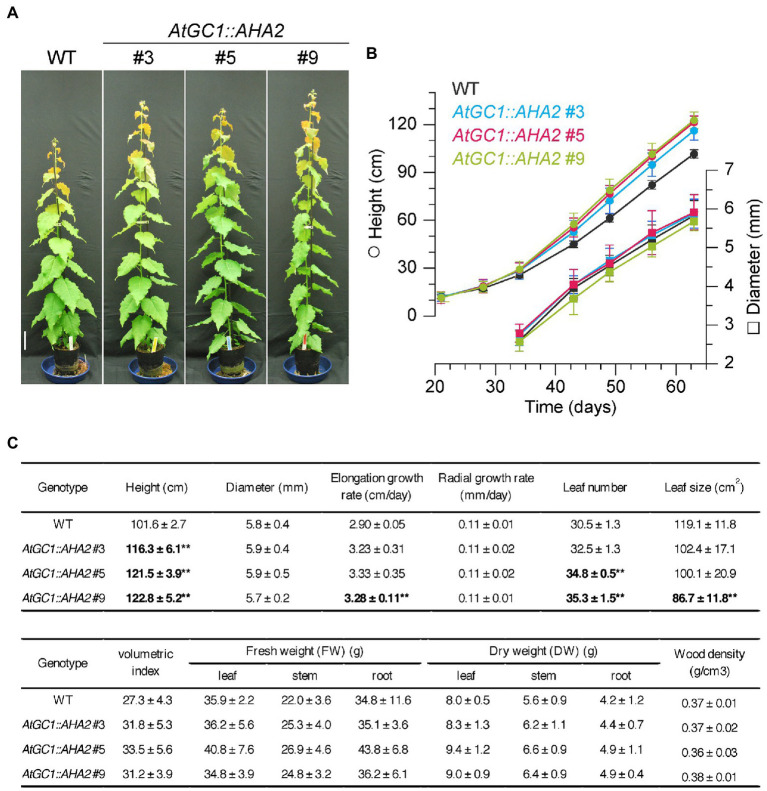
Figure 4.
Growth and biomass production of AtGC1::AHA2 transgenic and wild-type (WT) plants. (A) Growth phenotypes of 63-day-old transgenic and WT plants. Scale bar=10cm. (B) Height (circles) and diameter (squares) of the transgenic and WT plants against time over 63days of growth. (C) Growth rates and biomass production of transgenic and WT plants. Values are means±SD (n=4). Double asterisk indicates p<0.01 by Student’s t test followed by the Benjamini and Hochberg multiple test correction.

