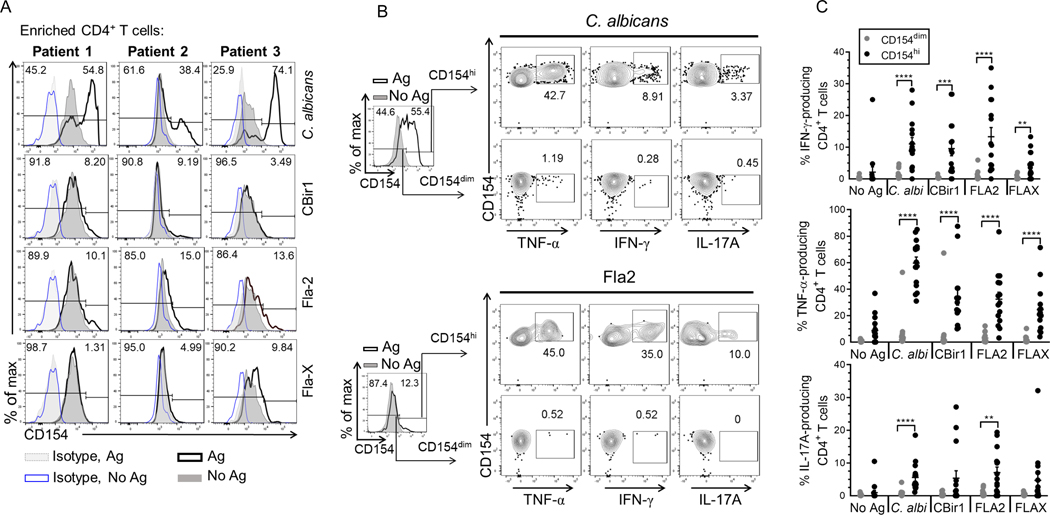
Figure 4. Defining the cytokine-producing subset within the CD154+ CD4+ T cells following antigen exposure.
(A) Representative histogram overlay plots for CD154 expression among Crohn’s patients (n = 3). Histogram overlay plots are shown with isotype controls for antigen exposed cells (grey dotted line) and unexposed cells (blue solid line). CD154 expression for antigen unexposed cells (dark grey solid line) and antigen exposed cells (black solid line). (B) Representative flow plots of cytokine production by CD154 expressing cells. Histogram overlay plots are shown with unexposed cells (dark grey solid lines) and the antigen exposed cells (solid black line). Contour plots of TNF-α, IL-17A, IFN-γ production by CD154dim/hiCD4+ T cells following C. albicans, or Fla-2 exposure. (C) The cumulative frequency of TNF-α, IFN-γ, IL-17A produced by CD154dim (grey circle) or CD154hi (black circle) CD4+ T cells following antigen exposure among Crohn’s patients (n = 15). Bars represent the means ± SEM. of fifteen independent experiments; Mann Whitney test. **p<0.01, ***p<0.001, ****p<0.0001.

