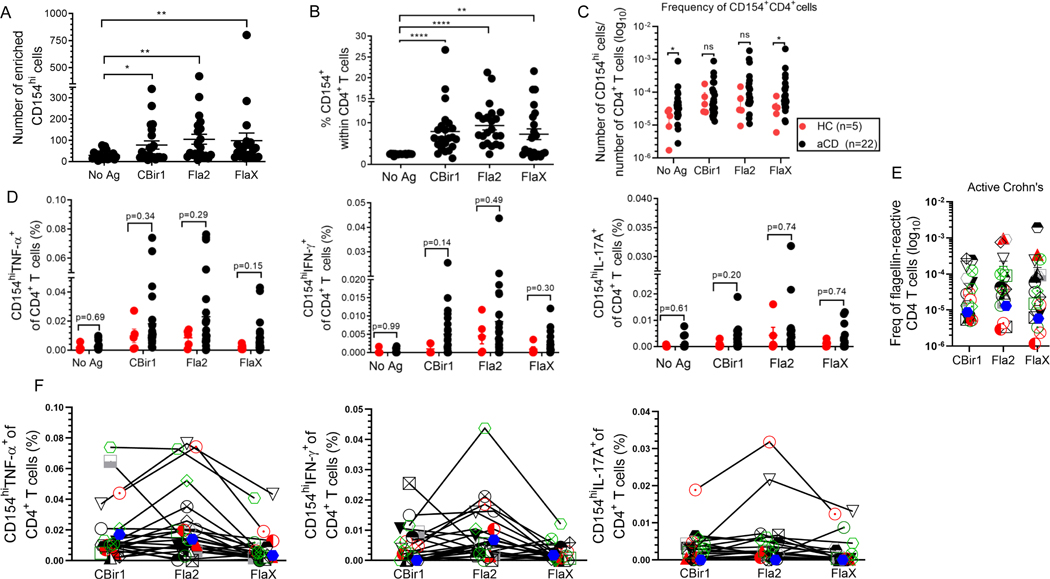
Figure 6. Flagellin-specific CD4+ T cells can be detected in Crohn’s and healthy patients. (A) CD4+ T cell responses to antigen exposure were analyzed in active Crohn’s (n = 22).
Number of enriched CD154hi cells active CD patients (n = 22). (B) Percentage of CD154hi cells among CD4+ T cells from active Crohn’s (n = 22) with expression above the background level of approximately 2.50%. (C) Frequencies of CD154hiCD4+ T cells in peripheral blood of active Crohn’s (black dots; n = 22) and healthy (red dots; n = 5) patients were calculated from the number of CD154hi cells obtained after enrichment normalized to the total number of CD4+ T cells applied on the column. (D) Frequency of cytokine producing cells among active Crohn’s (n = 22) and healthy (n = 5) patients were calculated from the total number of cytokine positive cells normalized to the total number of CD154hi cells obtained after enrichment. Bars represent the means ± SEM of five-twenty-two independent experiments; Mann Whitney test. *p<0.05, **p<0.01, ****p<0.0001. (E).The frequency of flagellin-specific CD4 T cells (stimulated sample minus Ag unexposed control for CD154hi cells; background-subtracted). (F). Comparison of CD154hiCD4+ T cells cytokine reactivity to different flagellin antigens within the same active Crohn’s patient (n = 22). Each symbol represents one patient (lines link result within the same active Crohn’s patient).

