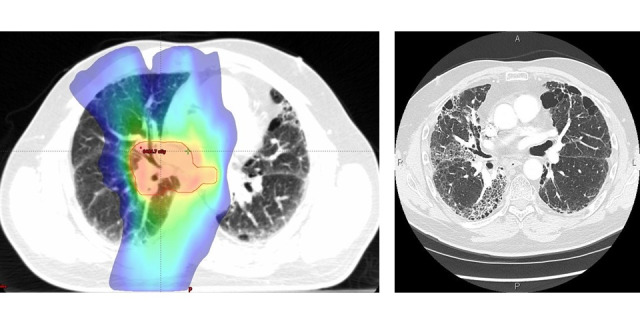
Figure 1.

Color wash of the dose distribution on a radiation therapy planning computed tomography for a patient with lung cancer (left). The blue edge represents the 20 gray dose line, which is the recognized dose associated with increased risk of radiation pneumonitis. The same patient’s 3-month follow-up computed tomography image showed opacity indicating a partial filling of the air spaces in the lungs. These radiologic changes are representative of radiation pneumonitis in the radiation field (right).
