Figure 5.

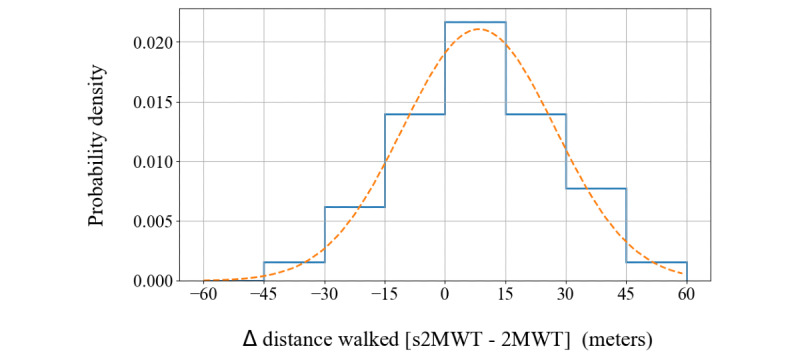
Distribution of differences between the measured distance walked by the app (smartphone-based 2-Minute Walking Test [s2MWT]) and the distance markers (2-Minute Walking Test [2MWT]). The dashed line represents a normal distribution.

Distribution of differences between the measured distance walked by the app (smartphone-based 2-Minute Walking Test [s2MWT]) and the distance markers (2-Minute Walking Test [2MWT]). The dashed line represents a normal distribution.