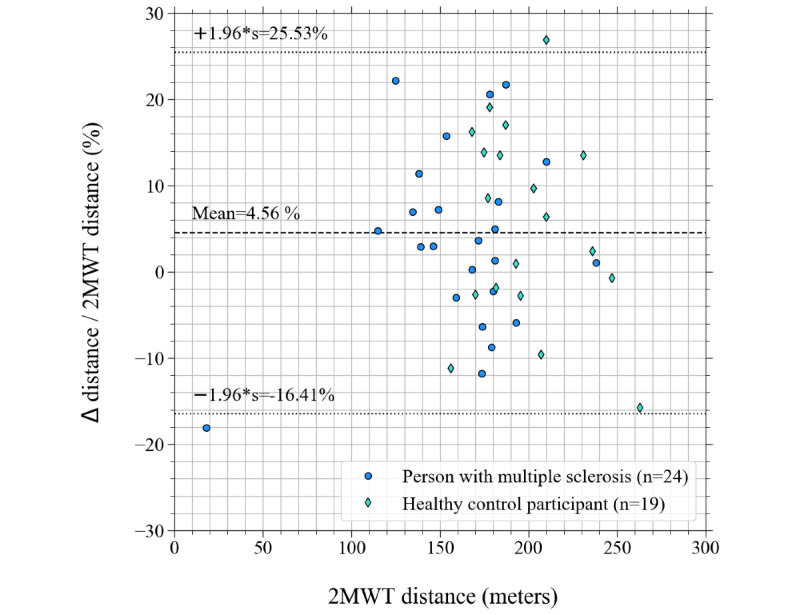
Figure 6.

Bland Altman plot of differences between the measured "distance walked" by the app (smartphone-based 2-Minute Walking Test distance) and the distance markers (2-Minute Walking Test distance) expressed as percentages of the 2-Minute Walking Test distance (∆ distance / 2-Minute Walking Test distance) versus the 2-Minute Walking Test distance. The dashed line shows the mean percentage difference, the dotted lines show the 95% CI.
