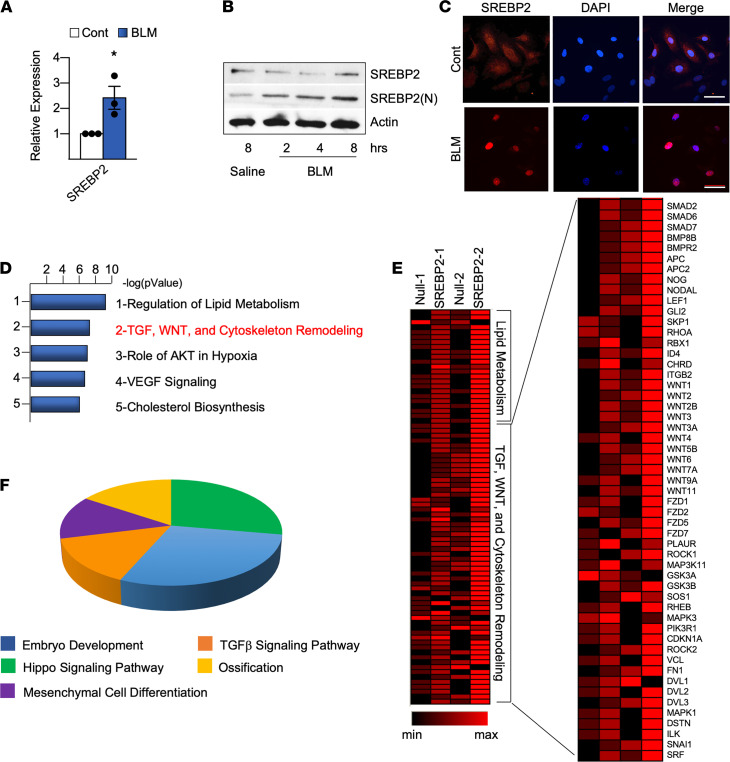
Figure 1. Bleomycin-induced (BLM-induced) SREBP2(N) mediates profibrotic pathways in ECs.
(A–C) HUVECs were stimulated with BLM (1 mU). (A) Following 72 hours of BLM treatment, mRNA was measured using qPCR. (B) N-terminal cleavage of SREBP2 was measured using Western blot. (C) Representative image of nuclear localization was determined with immunofluorescence using anti-SREBP2 (red) and DAPI (blue) (n = 3). Scale bar: 50 μm. (D–F) HUVECs were infected with Ad-SREBP2(N) or Ad-null (empty vector) for 72 hours (n = 2). Total RNA was isolated and analyzed by RNA-Seq. (D) Gene ontology (GO) analysis was performed for the top 500 upregulated genes in ECs overexpressing SREBP2(N). (E) Heatmap indicates the upregulated genes of n = 2 data sets in the TGF, WNT, Cytoskeleton Remodeling pathways. (F) PANTHER analysis of the genes listed in E. Data in A were analyzed by 2-tailed Student’s t test, and data are represented as mean ± SEM from 3 independent experiments (n = 3). *P < 0.05 between the indicated groups. WNT, wingless related integration site.

