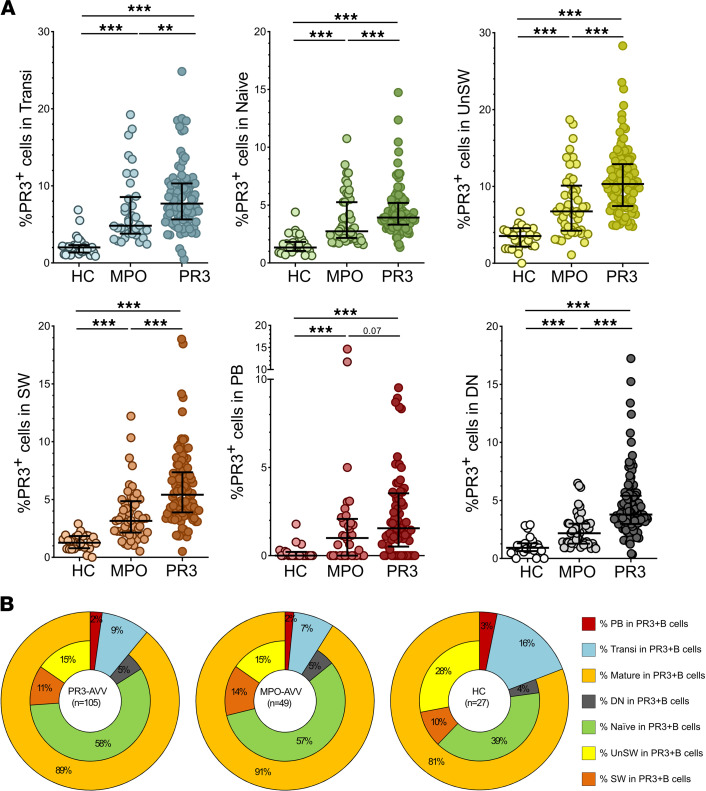
Figure 3. Frequency of PR3+ B cells within each B cell subset.
Scatter plots depicting the frequency of PR3+ B cells within each B cell subset in HCs (n = 27), patients with MPO-AAV (n = 49), and patients with PR3-AAV (n = 105) (A). B cell subset distribution within PR3+ pool in patients with PR3-AAV and MPO-AAV and HCs (B). Data represent median (25%–75% IQR). Multiple comparisons among more than 2 groups were performed with Kruskal-Wallis test. **P < 0.01, ***P < 0.001 after correction for FDR with Benjamini and Hochberg test.

