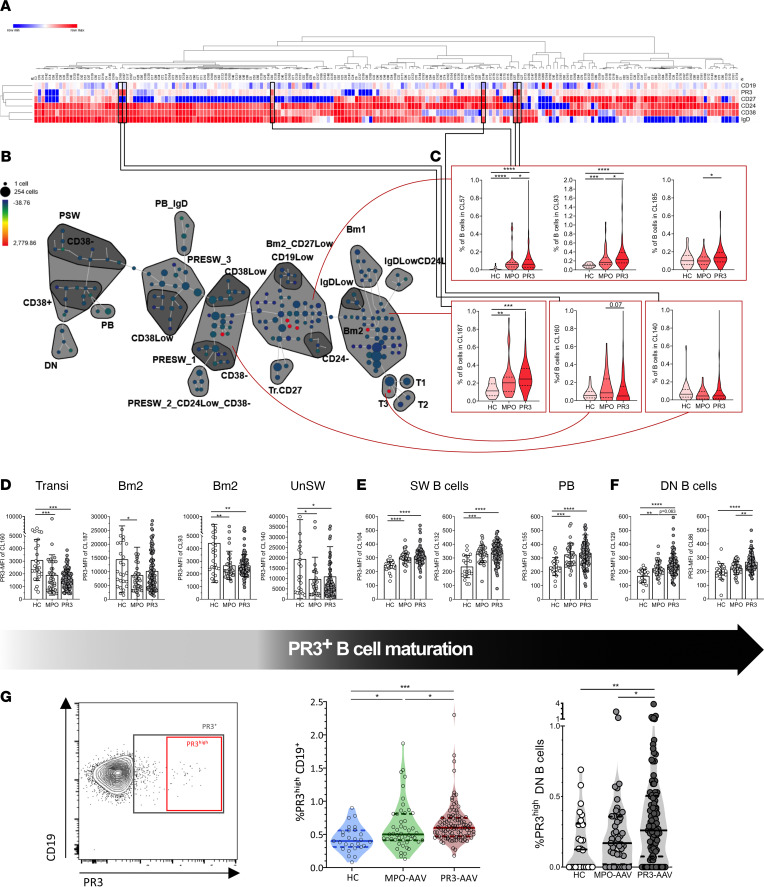
Figure 4. Selected PR3-reactive B cell clusters are significantly more represented or activated in patients with PR3-AAV.
Six of 200 clusters showed a stable expression of PR3 on the membrane of the B cells (A). A processed SPADE explanatory image of 1 patients with PR3-AAV, showing the most relevant clusters grouped by conventional subsets (B). In red, the six clusters of B cells with a stable increased reactivity for PR3 across all the samples, and their frequencies (C). The MFI of 4 of these 6 clusters is reduced in AAV compared with HCs (D). Additional 5 clusters with significantly varied MFI between HCs and patients with AAV: the MFIs of clusters within the SW memory and PB compartments are increased in patients with AAV compared with HCs (E), and 2 clusters within the DN showed a relative MFI increase in patients with PR3-AAV compared with patients with MPO-AAV and HCs (F). A more conservative gating approach (PR3hi) (G, left), showing the increase of PR3hi B cells in patients with PR3-AAV compared with those with MPO-AAV and HCs (G, middle). Among B cell subsets, PR3hi B cells were significantly increased only in the DN subset in participants with PR3-AAV compared with participants with MPO-AAV and HCs (G, right). Each point represents the frequency in an individual; horizontal lines show the median with 25%–75% IQR; each histogram represents mean ± SD. Multiple comparisons among more than 2 groups were performed with 1-way ANOVA or Kruskal-Wallis test, where appropriate. *P < 0.05, **P < 0.01, ***P < 0.001, ****P < 0.0001 after correction for FDR with Benjamini and Hochberg test. MFI, mean fluorescence intensity.

