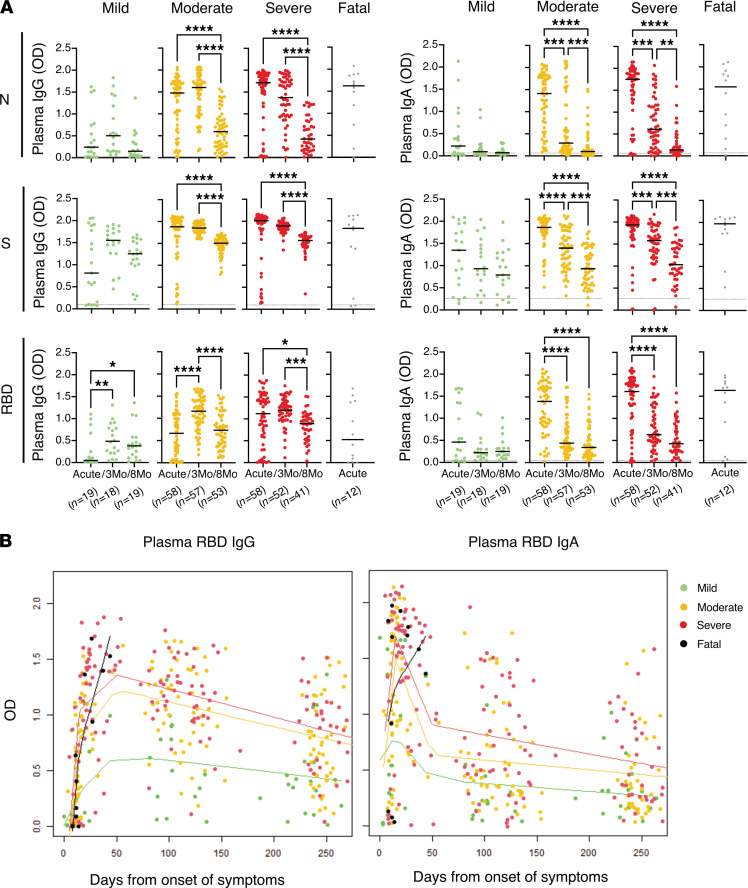
Figure 3. Longitudinal systemic antibody responses across COVID-19 severity from acute disease up to 8 months from symptom onset.
(A) Individual levels of plasma IgG and IgA (from left to right) in SARS-CoV-2–infected individuals (n = 147) with different PDS. Black lines indicate medians and dotted lines indicate the average background level from prepandemic healthy controls. Kruskal-Wallis with Dunn’s multiple comparisons was used to compare the groups and considered statistically significant at P < 0.05. *P < 0.05, **P < 0.01, ***P < 0.001, ****P < 0.0001. (B) Splines graphs of the plasma RBD IgG and IgA level changes over time (n = 19 for mild, n = 58 for moderate, n = 58 for severe, and n = 12 for fatal). All observations are graphed together with kernel-smoothed curves, and data points for each group color-coded as previously with the exception of the “fatal” group, which in this figure is highlighted in black. The bandwidth for the smoothing was set to 40, except for the “fatal” group, for which, due to few and concentrated observations, the bandwidth was set to 10.

