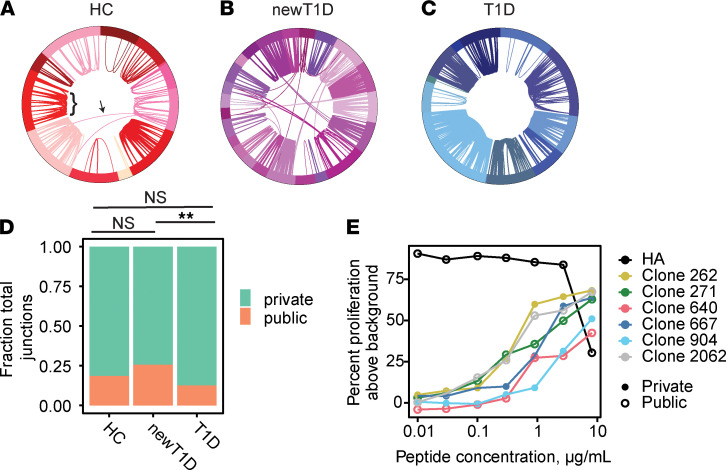
Figure 2. TCR diversity and clonotype sharing in IAR T cells.
(A–C) Segments in the circos plots represent individual cells yielding TRA or TRB junctions listed in Supplemental Table 3 (n = 808, 1784, and 1481 filtered junctions for HC, newT1D, and T1D, respectively). Junction sharing (TRA or TRB) is indicated by arcs connecting different cells; arc thickness indicates number of junctions shared. Different donors are indicated by different colors in the outer ring. Arcs within donors represent expanded private junctions (bracket); arcs crossing between donors represent public junctions (arrow). (A) TCR sharing in IAR T cells from HC donors. (B) TCR sharing in individual IAR T cells from newT1D donors. (C) TCR sharing in individual IAR T cells from T1D donors. (D) Median numbers of public and private TCR chains vary by disease group. Frequencies of combined filtered public (n = 270) and private (n = 1130) junctions (Supplemental Table 3, public/private TCRs) were compared. Median junction numbers were tabulated in HC, newT1D, and T1D groups after iterative downsampling to equivalent numbers of expanded junctions (10,000 iterations, 183 junctions per subject group). Median numbers of public junctions were 34, 48, and 23 from HC, newT1D, and T1D, respectively. Significance of differences in public and private junctions by disease group was assessed using 2-by-2 contingency tables of numbers of public versus private chains by disease group, using Fisher’s exact test. **, FDR < 1 × 10⁻²; NS, not significant. (E) Public and private TCRs show similar functional avidity for GAD 113–132 versus a TCR recognizing an influenza HA peptide.

