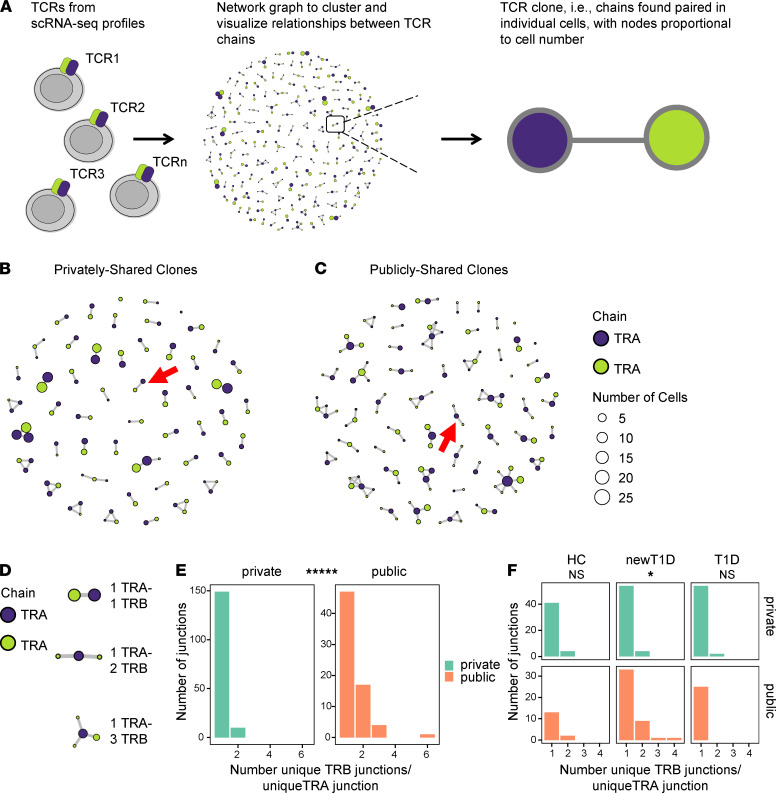
Figure 4. tcrGraph enables visualization of differing community structures of public and private clonotypes.
(A) Clustering and network visualization of TCRs using tcrGraph. Each graph shows edges (lines) linking nodes (circles) of associated TRA (blue) and TRB (green) junctions. Node size is proportional to the number of cells containing a particular TCR chain, as indicated by the scale panel. (B and C) Network structures of public and private TCRs from all donors. For better visualization, private clones were randomly downsampled to equivalent numbers of clones as public TCRs (n = 55). Red arrows indicate major structures for each group (1 TRA-2 TRB and 1 TRA- 1 TRB for public and private clones, respectively). (D) Combinations of unique TRB chains associated with identical TRA chains identified by tcrGraph. (E) Numbers of TRB junctions paired with unique public and private TRA junctions were calculated (n = 72 and 165 unique public and private TRA junctions, respectively) (Supplemental Table 3, public/private TCRs). The significance of 1 versus multiple TRB junctions per TRA junction in unique public and private TCRs was assessed using a Fisher’s exact test. *****, FDR < 1 × 10⁻⁵. (F) Public TRA junctions were more associated with multiple TRB junctions in newT1D than in HC and T1D. As in E but broken down by disease group. *, FDR < 0.05; NS, not significant.

