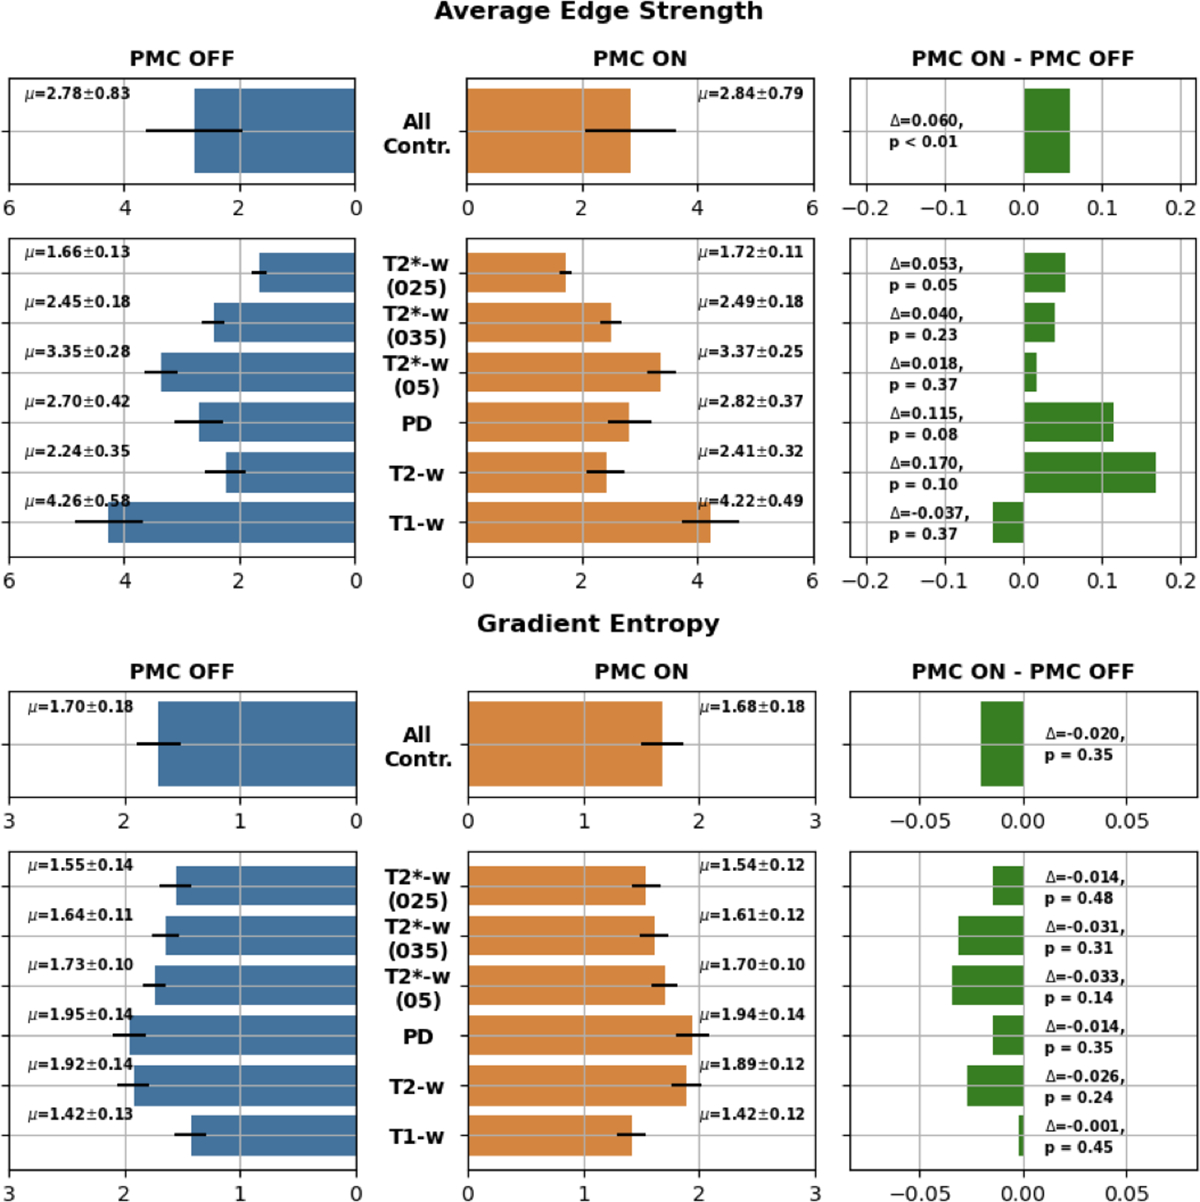
FIGURE 7. Results of the objective assessment.

Bar plots containing average scores calculated for each group and for all groups together. Top: Average Edge Strength; Bottom: Gradient Entropy.

Bar plots containing average scores calculated for each group and for all groups together. Top: Average Edge Strength; Bottom: Gradient Entropy.