. 2021 Sep;25(9):1042–1048. doi: 10.5005/jp-journals-10071-23978
Copyright © 2021; Jaypee Brothers Medical Publishers (P) Ltd.
© Jaypee Brothers Medical Publishers. 2021 Open Access This article is distributed under the terms of the Creative Commons Attribution 4.0 International License (https://creativecommons.org/licenses/by-nc/4.0/), which permits unrestricted use, distribution, and non-commercial reproduction in any medium, provided you give appropriate credit to the original author(s) and the source, provide a link to the Creative Commons license, and indicate if changes were made. The Creative Commons Public Domain Dedication waiver (http://creativecommons.org/publicdomain/zero/1.0/) applies to the data made available in this article, unless otherwise stated.
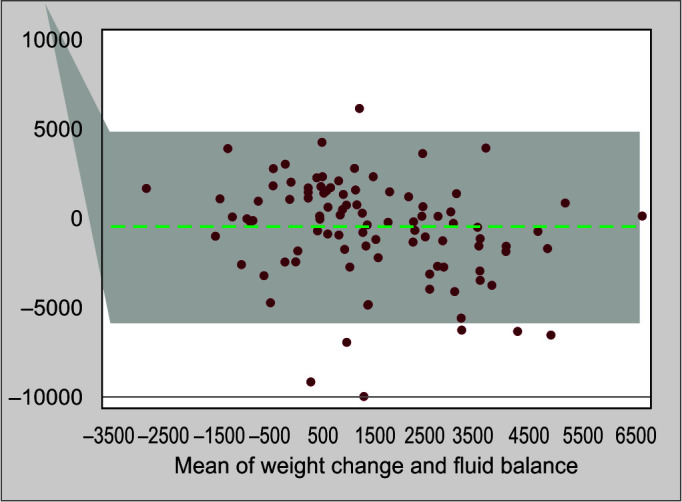
Fig. 2.

Bland–Altman plot depicting the agreement between fluid balance and weight change on day 3
