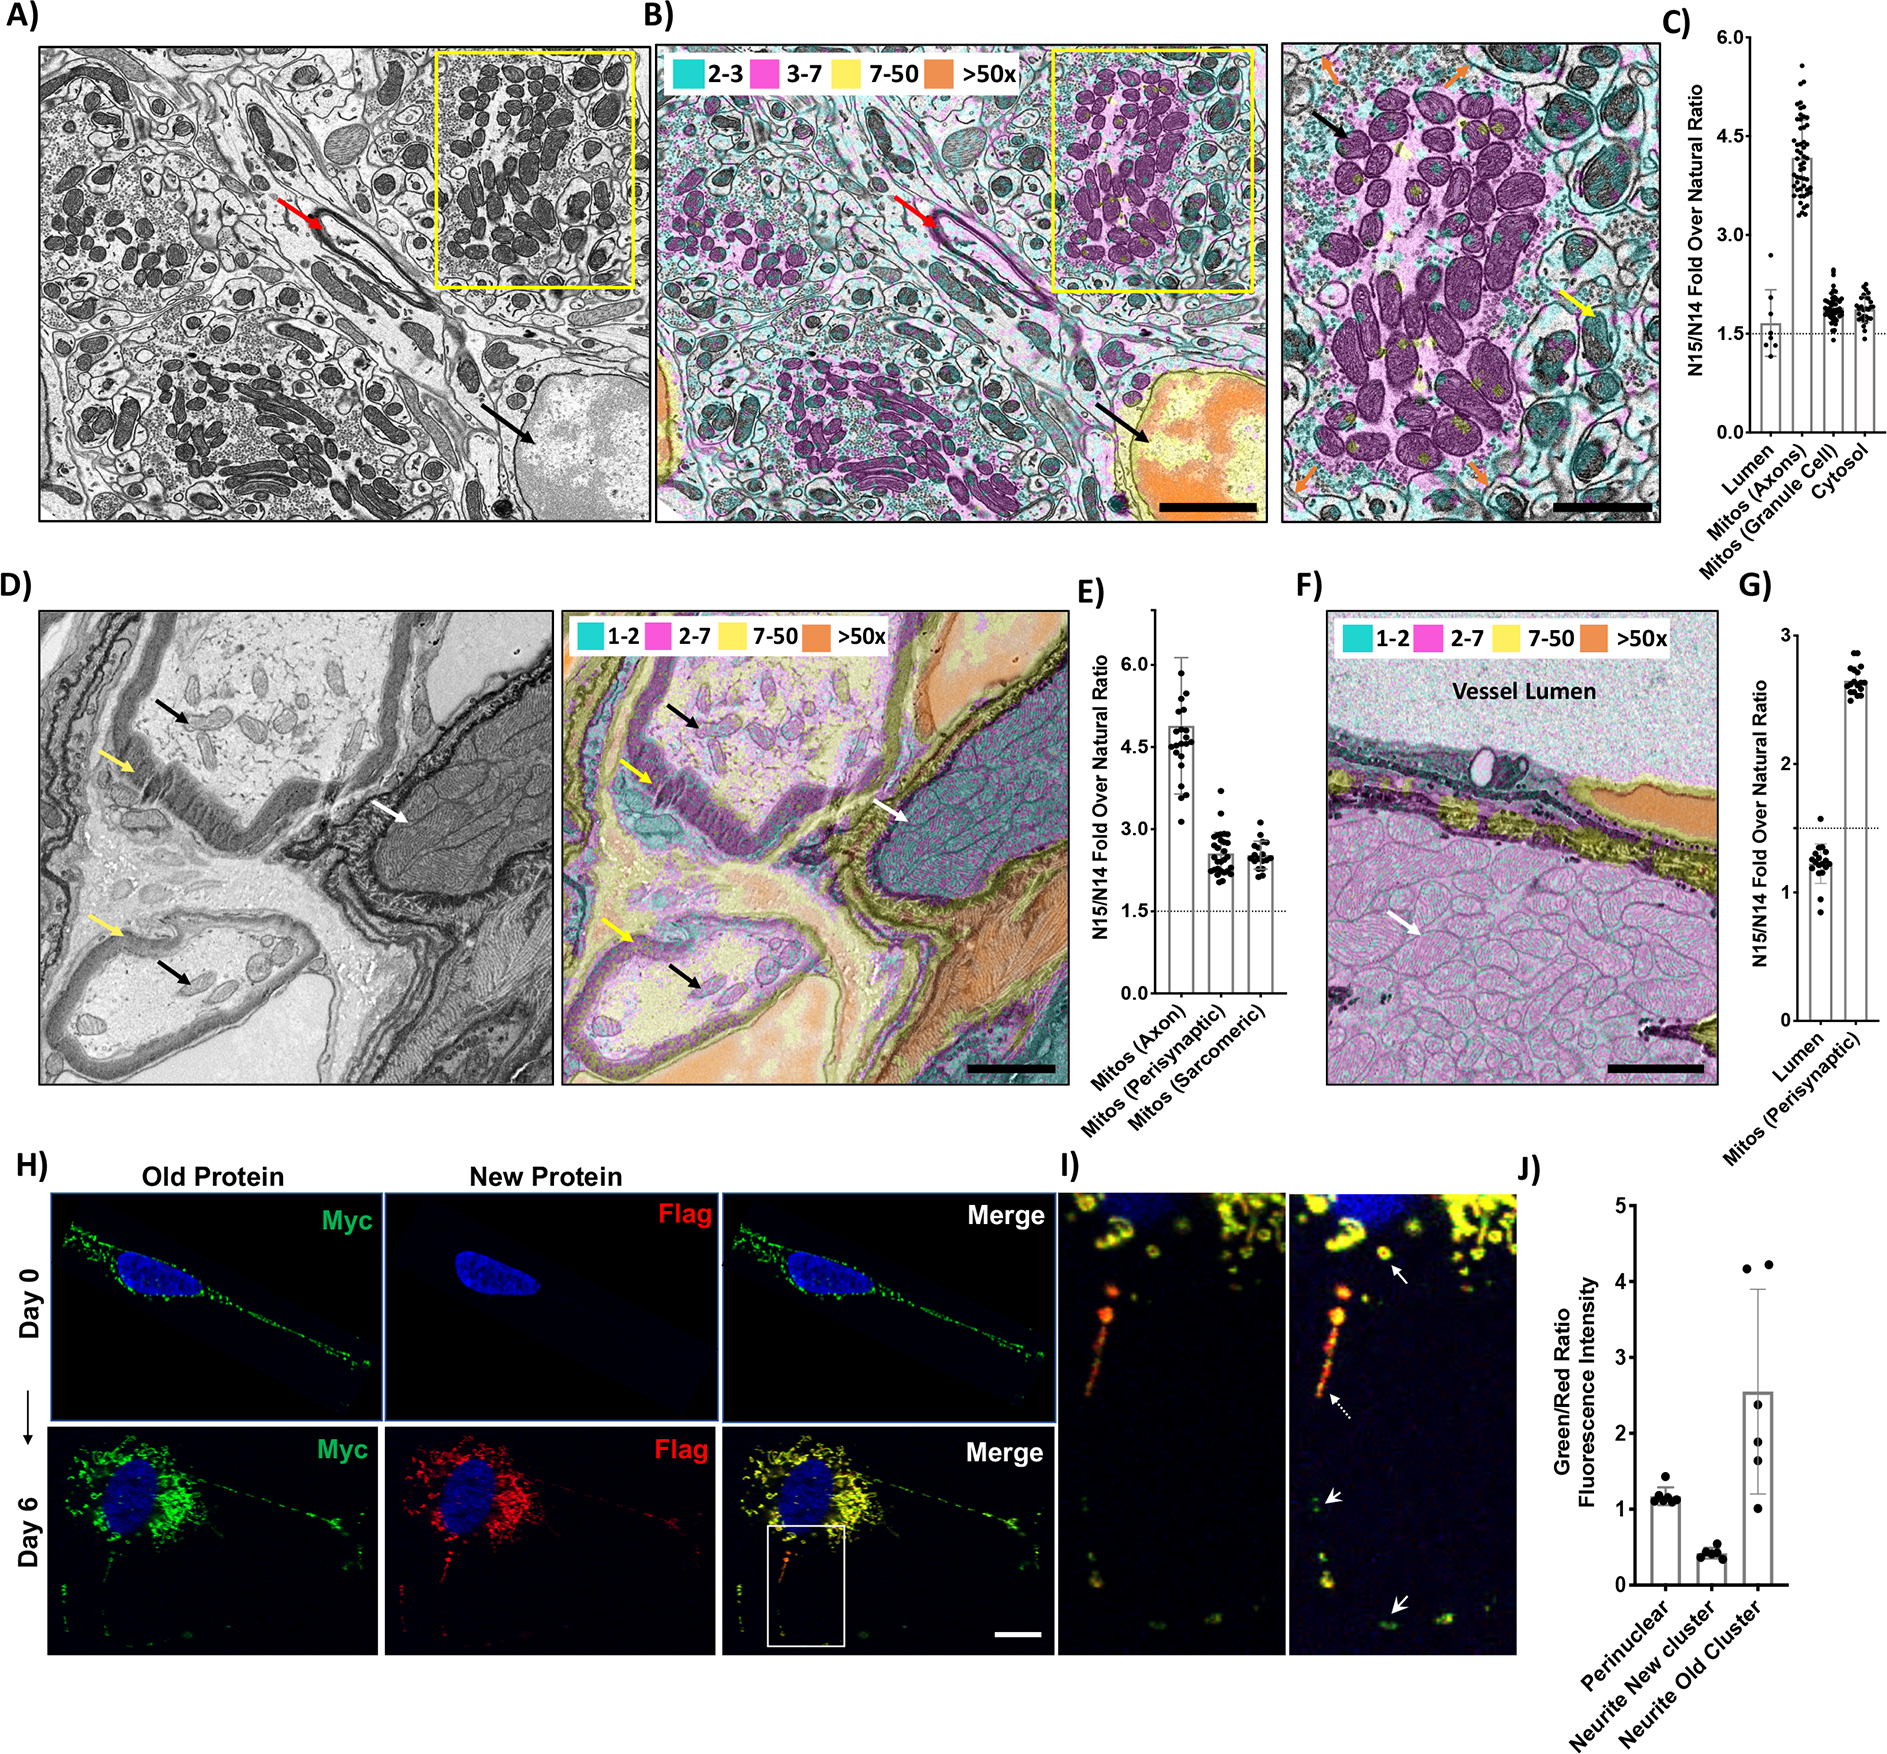
Figure 1. Discovery of long-lived mitochondria in post-mitotic tissues of 6-month old mice.

A) SEM image and B) MIMS overlay of cerebellar neurons from a 6-month chase mouse. Nucleus of a granule cell neuron (black arrow), myelin sheath (red arrows) and mitochondria (inset, B-right panel) are indicated. Inset shows mitochondria in mossy fibers axons containing “higher” (black arrow) and granule cell dendrites containing “lower” (yellow arrow) signal. Orange arrows show the boundary between mossy fiber axons and granule cell dendrites.15N/14N signal thresholds over the natural ratio (NR) of 37×10−4: 2–3x (cyan), 3–7x (magenta), 7–50x (yellow), >50x (vermillion). C) Dot plot overlaid with a bar graph shows the 15N/14N fold over the NR for blood vessel lumen (Lumen, n=8), mitochondria from mossy fiber axons (Mitos-Axons, n=53), mitochondria from granule cell dendrites (Mitos-Granule cells, n=50) and the cytosol (Cytosol, n=29). For the mitos plots, each dot represents the 15N/14N fold ratio for individual mitochondria whereas for the lumen and cytosol, each dot represents different regions of those structures. D) SEM image (left) and MIMS overlay (right) of myelinated axons near a neuromuscular junction in intercostal muscle from a 6-month chase mouse. Individual mitochondria in two myelinated axons (mitochondria – black arrows, myelin - yellow arrows) and perisynaptic mitochondria aggregates in a muscle fiber (white arrow) are indicated. 15N/14N thresholds: 1–2x (cyan), 2–7x (magenta), 7–50x (yellow), >50x (vermillion). E) Dot plot overlaid with a bar graph shows the 15N/14N fold over NR for mitochondria from axons (n=23) and perisynaptic aggregates (n=28), and sarcomeric mitochondria in the muscle fiber (n=18). F) MIMS overlay of intercostal muscle fiber containing mitochondria (white arrow) next to a vessel lumen (indicated). G) Graph shows the 15N/14N fold over NR for regions of the blood vessel lumen (Lumen, n=18) and mitochondria (Mitos, n=18). H) Turnover of ATP5C1 in SHSY-5Y neurons as measured by RITE. Images show green Myc tag (old protein, left panel) and red Flag tag (new protein, middle panel) at Day 0 (top panel) and Day 6 in (bottom panel). Merge is shown in right panel. I) An inset from the merge at lower (left image) and higher fluorescent intensity (right image) shows green and red signal in mitochondria that are peri-nuclear (white arrow) or in neurites with old (white arrowhead) and new (white dashed arrow) clusters indicated. J) Graph shows the Green/Red Fluorescence Intensity over background for the mitochondria shown in the inset (Perinuclear n=7, neurites new cluster n=6, neurites old cluster n=6).
For all MIMS-EM graphs, a dotted line is drawn at the background 15N/14N of 1.5x NR and error bars indicate SD. Scale bars: 5μm (B), 2.5μm (B, inset, D, F), 10μm (H).
