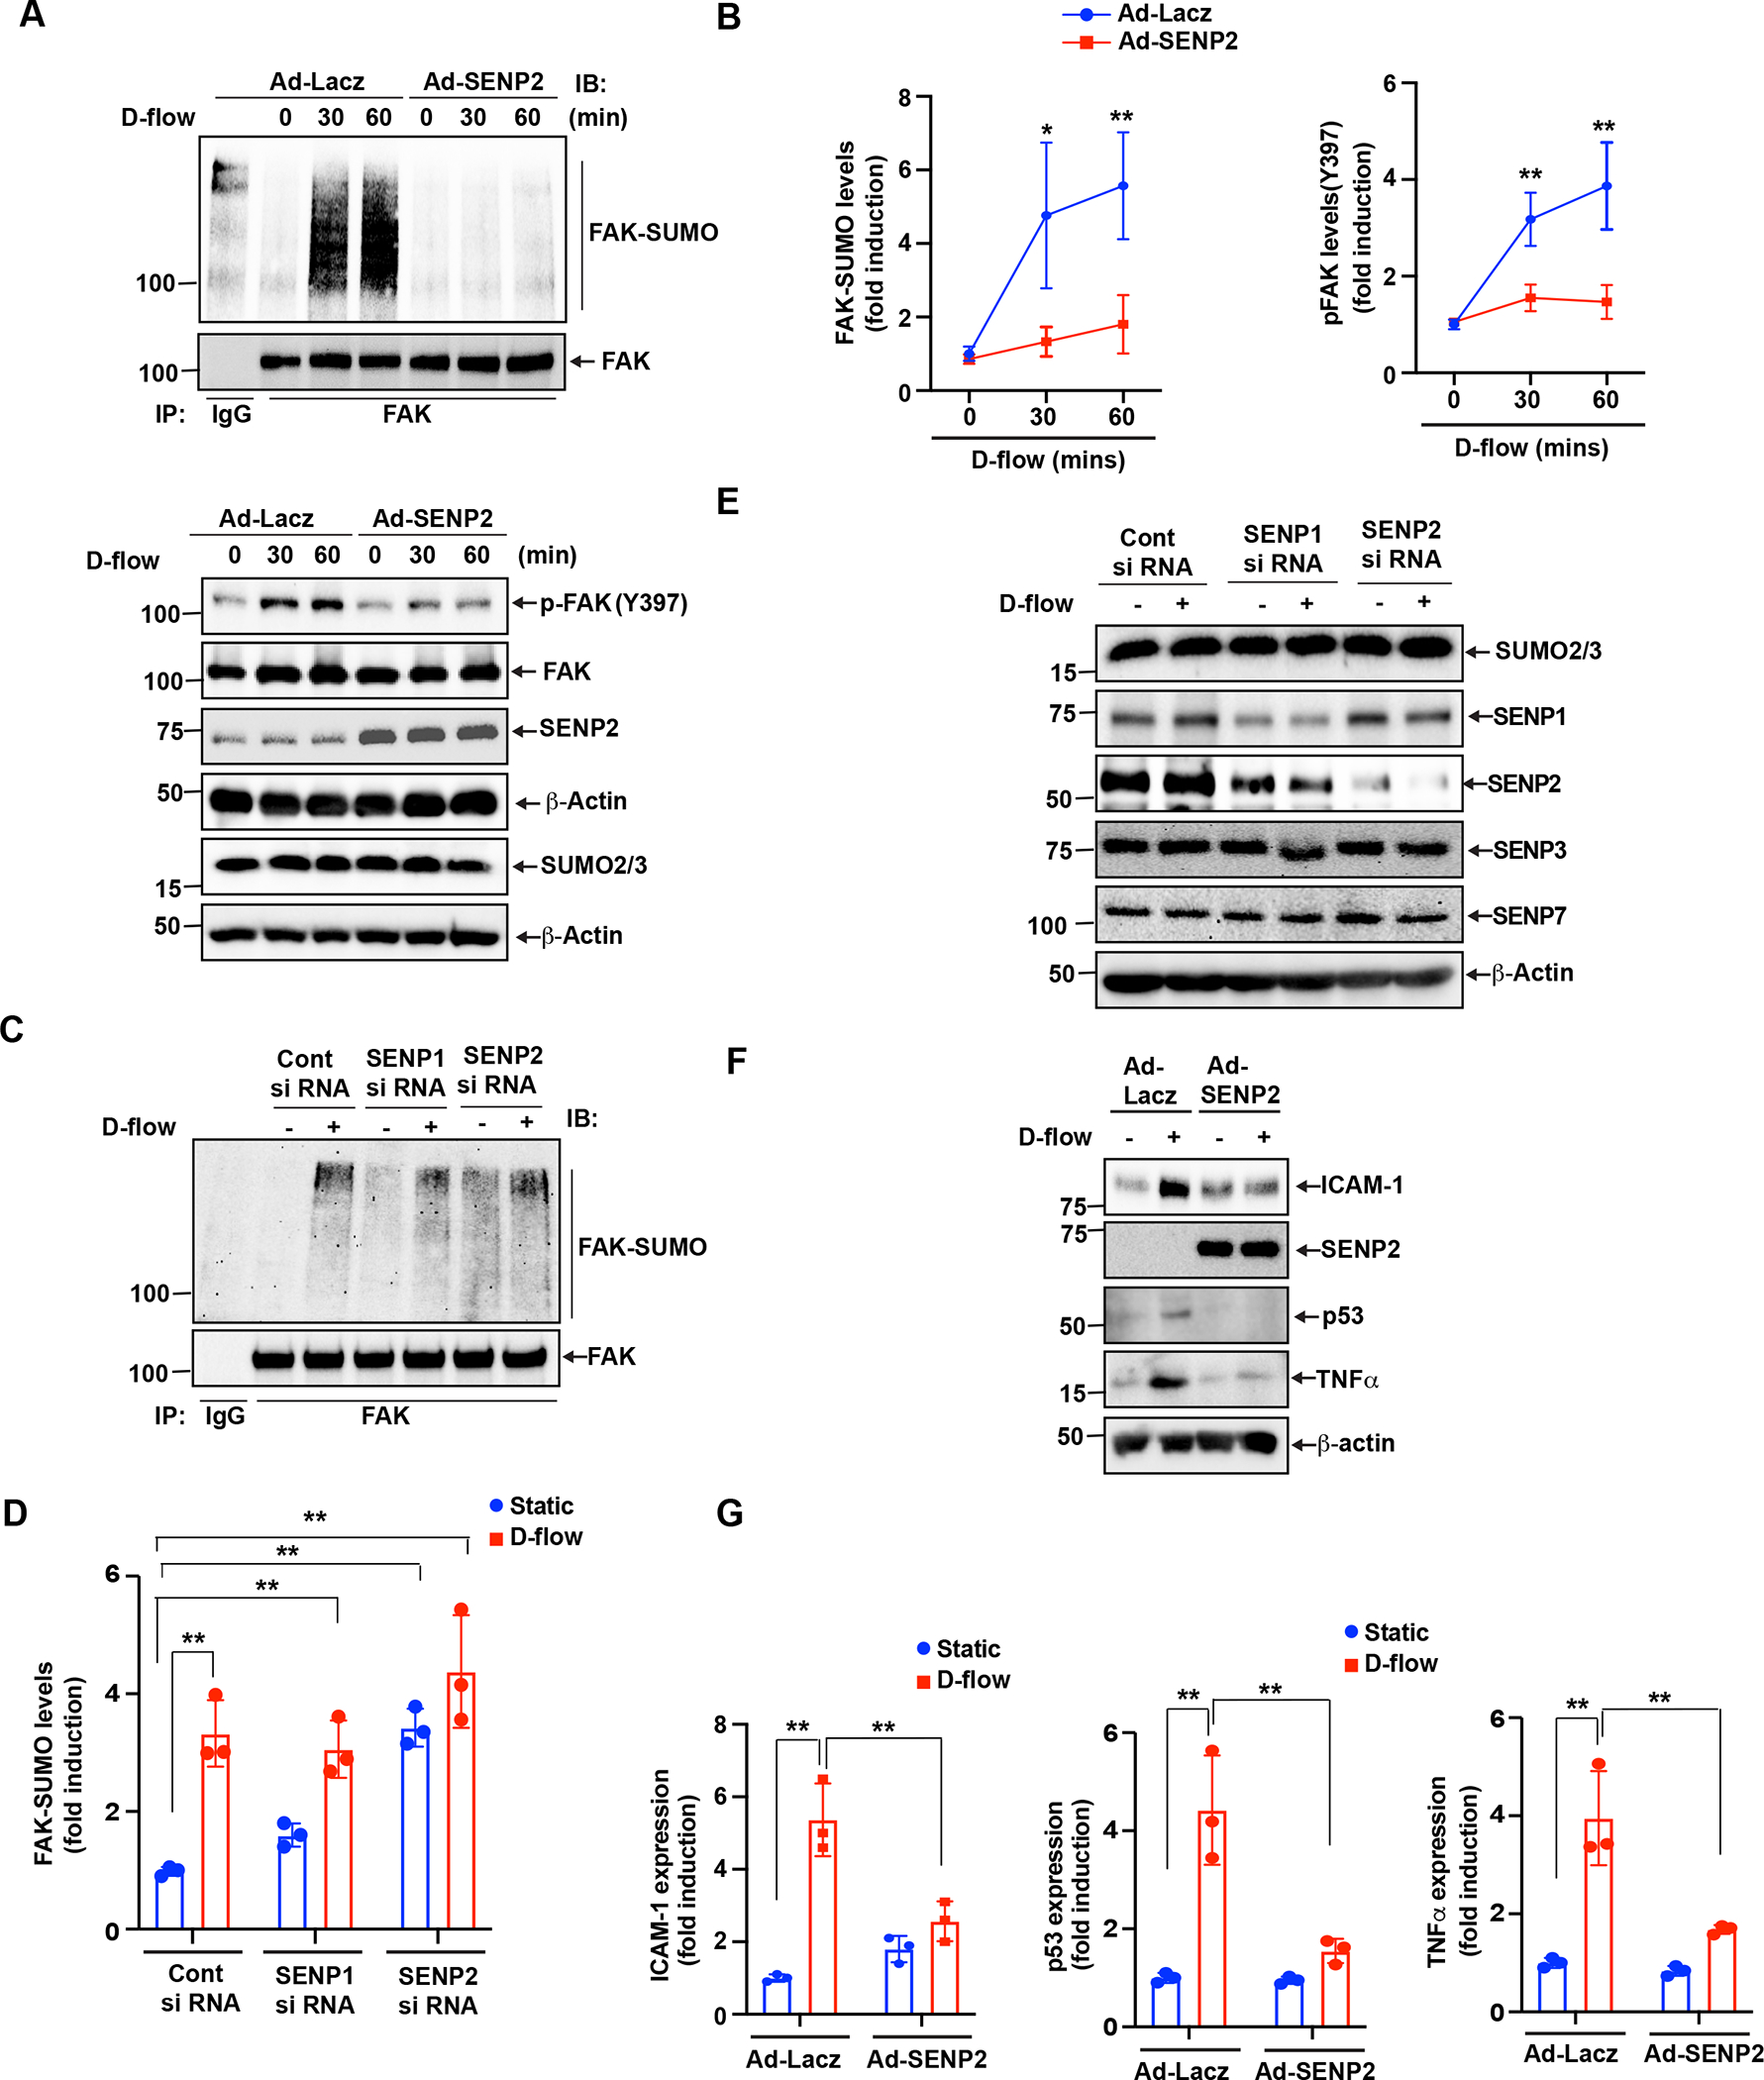
Figure 1: D-flow increases FAK K152 SUMOylation in endothelial cells.

(A-B) HUVECs transduced with Ad-LacZ or -SENP2 were exposed to D-flow for different times as indicated. The level (intensity of region of interest) of SUMOylated FAK was detected in the resulted lysates. Briefly, the lysates were subjected to immunoprecipitation assay using anti-rabbit FAK (or immunoglobulin G as a control). The resulted proteins were then separated by electrophoresis and transferred onto PVDF membranes. Then, level of SUMOylated FAK was detected by immunoblotting with an anti-SUMO2/3. Finally, the same membrane was subjected to IB with anti-FAK as the input control. Shown are representative SUMOylated FAK and input FAK immunoblots (A-uper). Expression of SUMO2/3 was assessed by western blotting(A-lower). Y397 phosphorylated and total FAK were detected in the resulted lysates by IB with specific antibodies as indicated. Blot was reprobed for SENP2 and β-actin (loading control) to show normalization (A-lower). Intensity of the SUMOylated, and phosphorylated FAK region was quantified and represent mean±SD (n=3), **P<0.01 (B). (C-D) HUVECs were transfected with SENP1 or SENP2 or Control siRNA and exposed with and without D-flow. Equal amounts of protein from control and each treatment were immunoprecipitated with anti-FAK antibodies, followed by immunoblotting with the anti-SUMO2/3 antibody. Graph shows densitometric quantification of FAK SUMOylation, which was normalized by total FAK levels. Data represent mean ± SD, n = 3, **P < 0.01 (D). (E) Same Cell extracts were also analyzed by Western blotting for SENP1, SENP2, SENP3, and SENP7 expression levels using their specific antibodies and normalized to β-actin to show the effects of siRNAs on their target and off-target molecules. (F-G) ECs transduced with Ad-LacZ or Ad-SENP2 were exposed to DF for 24 hr. Expression of ICAM1, SENP2, TNF-α, and p53 analyzed by westernbltting and normalized to β-actin (C). Intensity of ICAM1, TNF-α and p53 was quantified and represent mean±SD (n=3) *P<0.05, **P<0.01 (G). For protein simple WES system, protein bands are shown as pseudoblots (A).
