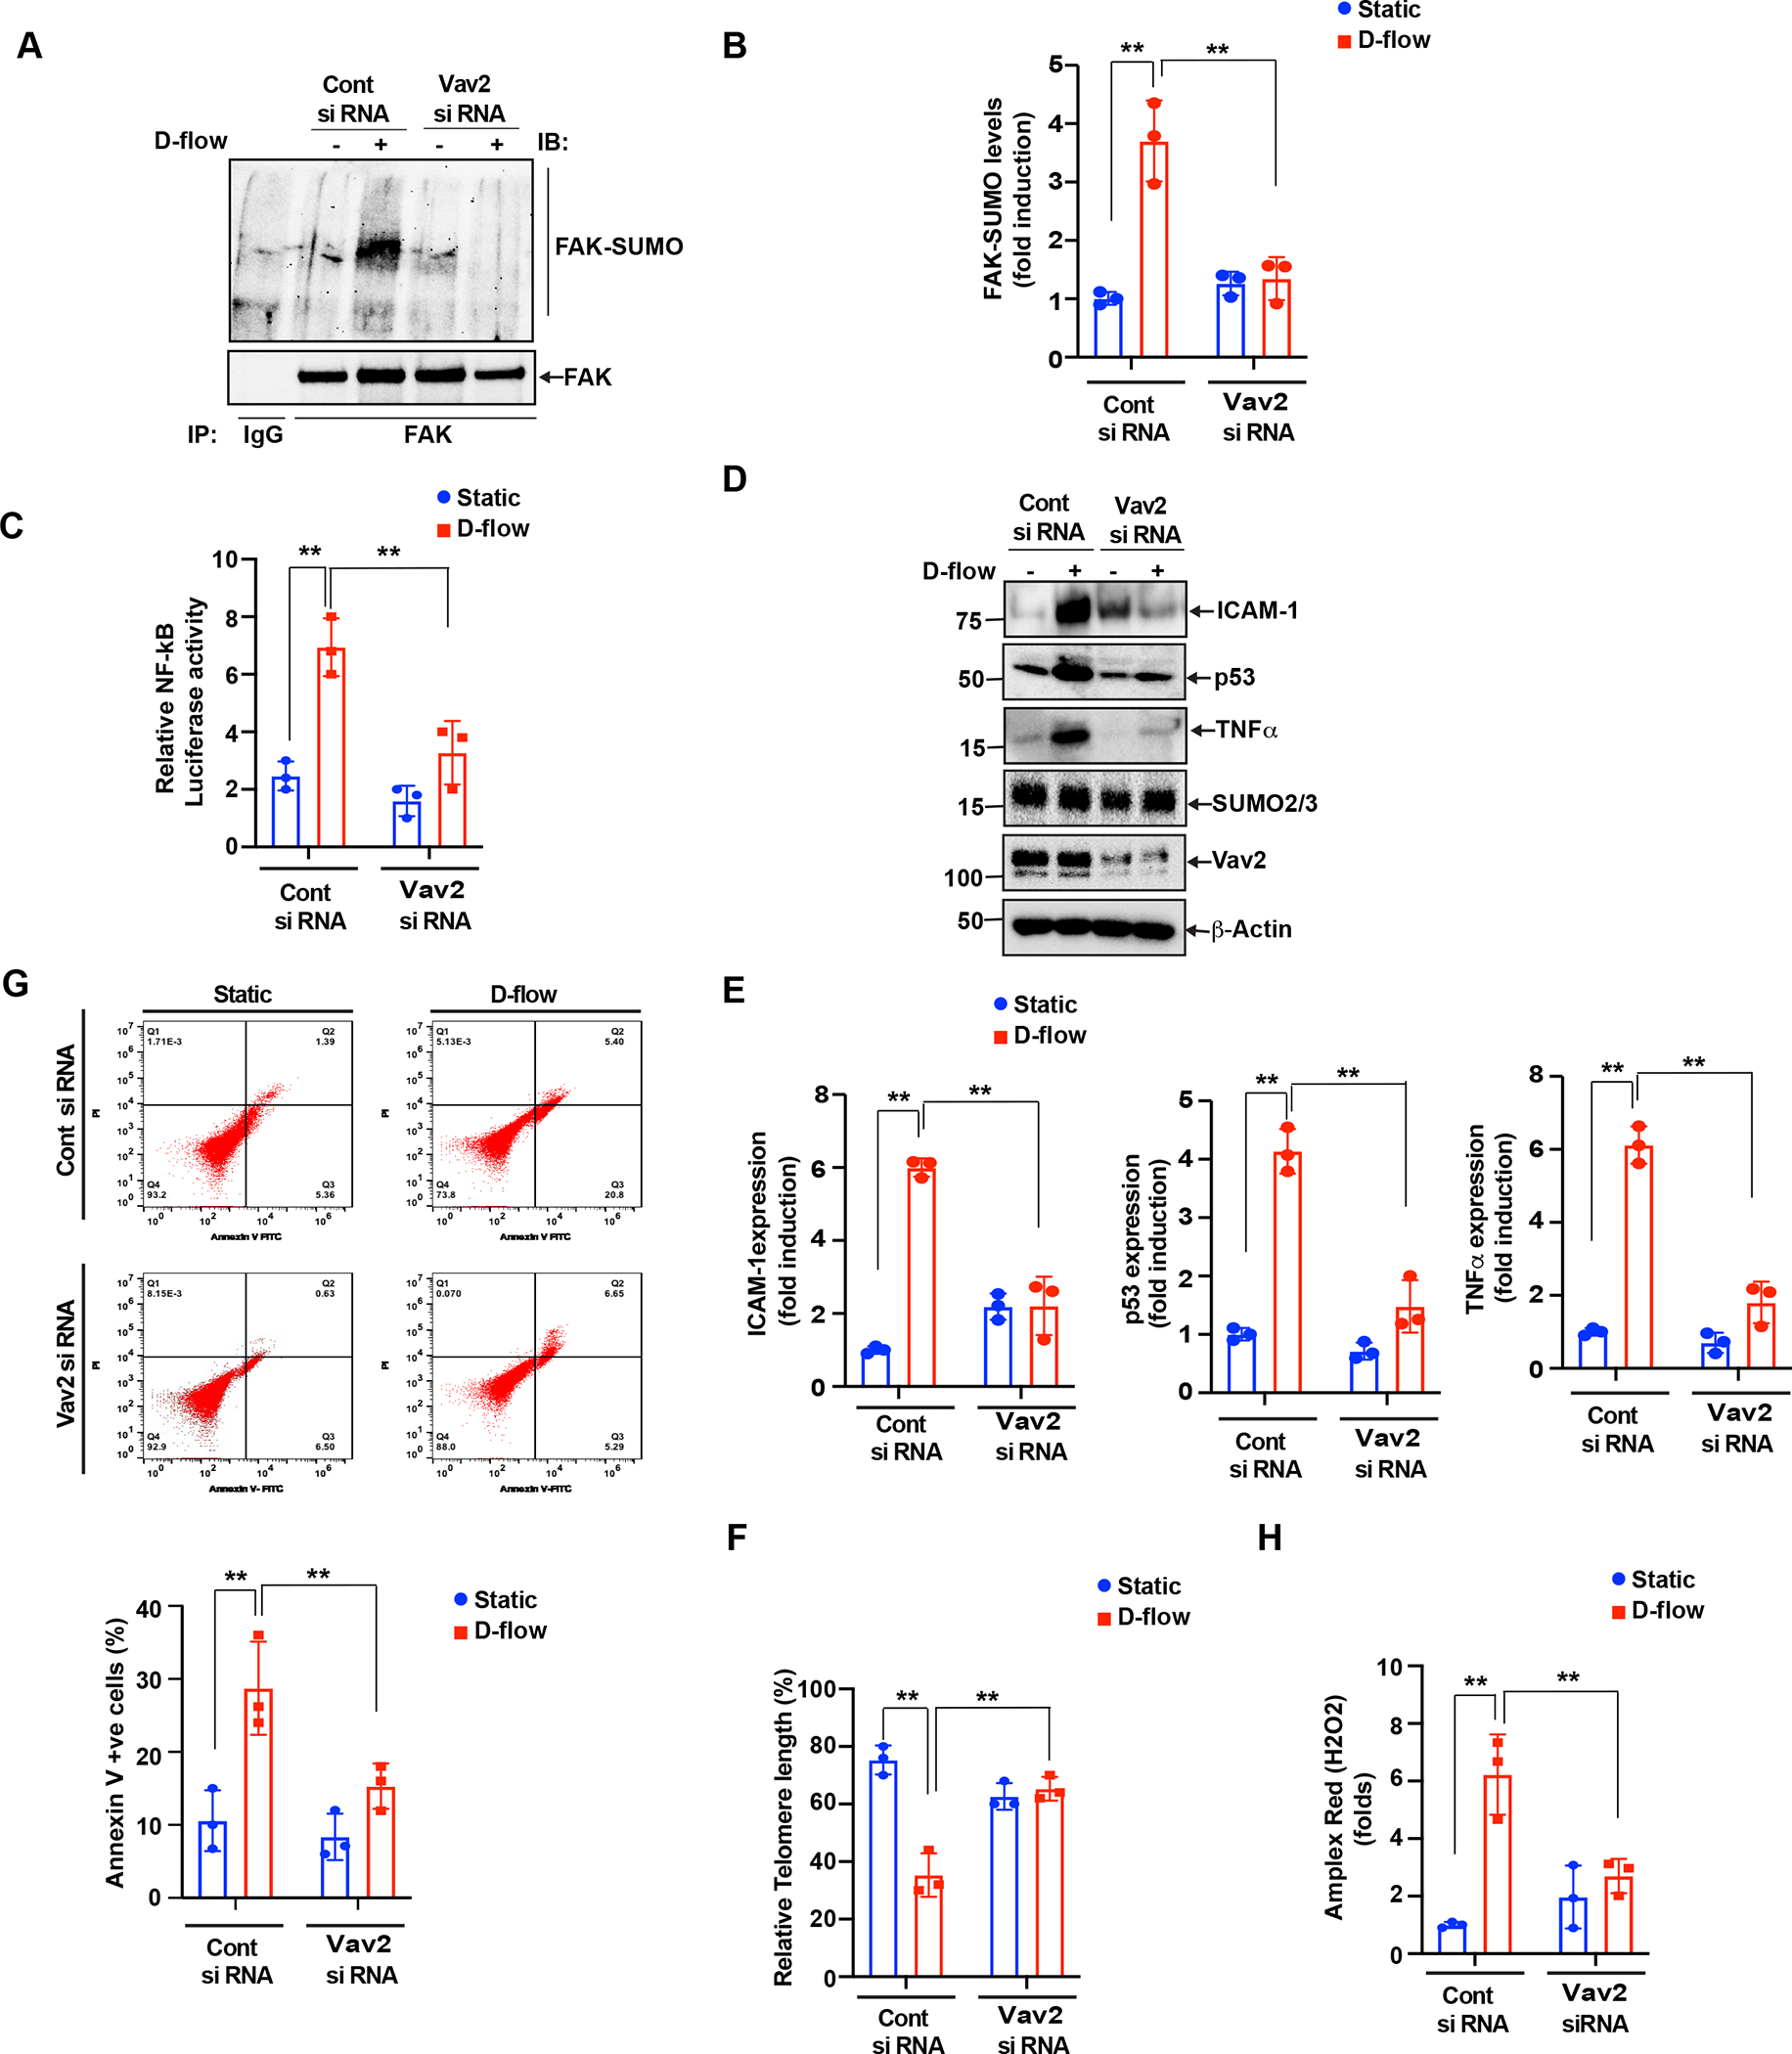
Figure 4: The role played by Vav2 phosphorylation in endothelial cell activation and senescence.

(A-B) (A). HUVECs were transfected with Control SiRNA or Vav2 siRNA (100 nm) and then exposed to D-flow 60 min and cell extracts were prepared. Equal amount of protein from control and each treatment were immunoprecipitated with anti-FAK antibody, and the immunocomplexes were analyzed by Western blotting for the SUMO2/3 antibody and normalized to FAK. The bar graphs represent densitometry quantitative analysis of three independent experiments. The values are presented as Mean ± SD n = 3, **P < 0.01 (B). (C) NF-kB activity was measured as we described in Figure 2C and Materials and Methods. The graph shows Mean±SD (n=3). **P<0.01. (D-E) (D) All of the conditions were the same as for A, except that after SiRNA transfection, the cells were exposed with D-flow or static conditions for 24 hours, and cell extracts were prepared. Equal amounts of protein from control and each treatment were analyzed by Western blotting for ICAM-1, TNF-α, p53, Vav2, and SUMO2/3 expression levels using their specific antibodies and normalized to β-actin. The bar graph represents densitometry Quantitative analysis of three independent experiments. Data represent mean ± SD values of three experiments n=3, **P < 0.01 (E). HUVECs pre-treated with either the control or Vav2 siRNA were exposed to D-flow for 24 hr. (F) Percentages of annexin V–positive cells determined by flow cytometry. Shown is a representative data from three biological replications. Mean±SD (n=3) **P<0.01. (G) The TL length was assayed using the TL PNA kit/FITC for flow cytometry. The mean fluorescence intensity was used to estimate the relative TL length. Data were analyzed using FlowJo software and results plotted as mean±SD (n=3). **P<0.01. (H) ROS levels in cells transfected with control siRNA or Vav2 siRNA and treated with or without D-flow for 2 hr. Data represent mean ± SD. n = 3, **P<0.01.
