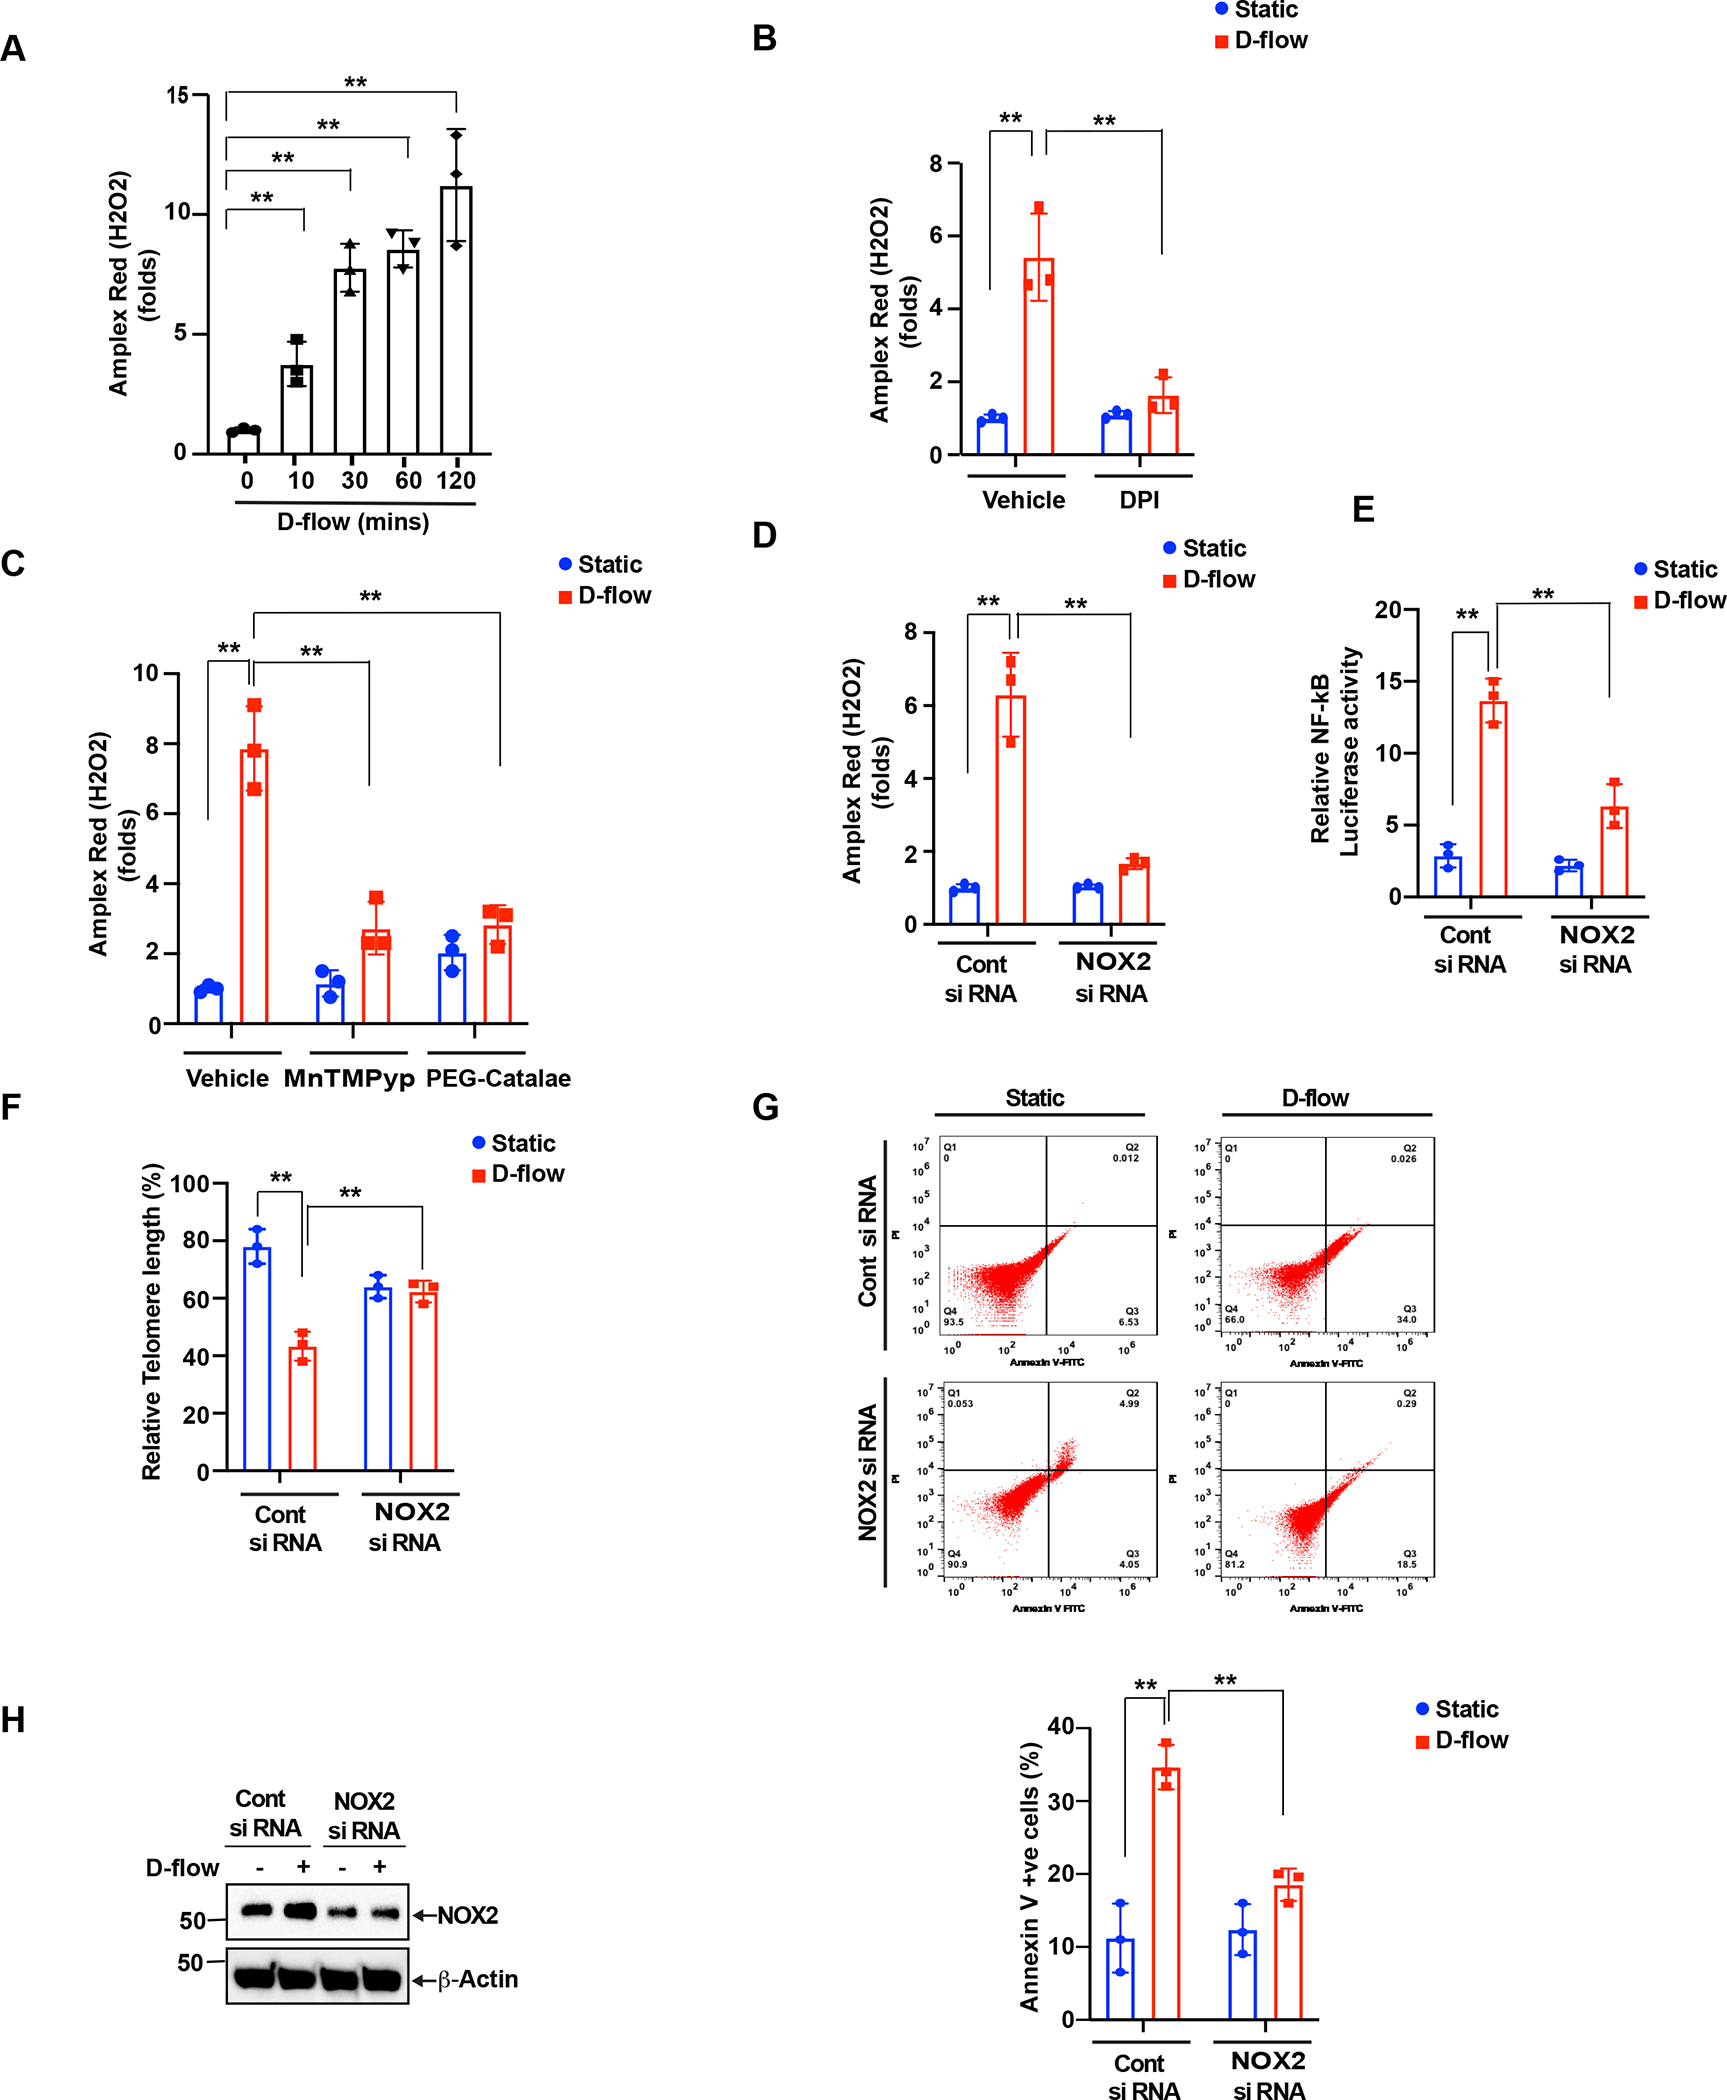
Figure 5: NADPH oxidase 2 activation in DF-induced endothelia cell activation and senescence.

Modulation of cellular hydrogen peroxide production. (A). HUVECs cells were exposed with D-flow, and H2O2 levels determined by Amplex Red assay. Panel A shows the time course of H2O2 production following treatment with D-flow. (B). H2O2 production in HUVECs that were pre-treated with or without DPI (10 μM) for 1 hr and exposed or not exposed to D-flow for 2 hr. Data are presented as mean ± SD (n=3). **P<0.01. In panel C shows cells were pre-treated with PEG-catalase (100 U/ml) or MnTMPyP (10 μM) for 1hr and then exposed to D-flow or static conditions for 2hrs and measured H2O2 levels by using Amplex Red assay. (D). Cells were transfected with siRNA (100 nm) to knock down NOX2 and then exposed to D-flow and static conditions for 2 hrs. H2O2 levels were measured with Amplex Red assay. Data are presented as mean ± SD (n=3). **P<0.01. (E) NOX2 depletion inhibits NF-κB activation. HUVECs were transfected with control or NOX2 targeted siRNA and then treated with or without D-flow for 24 hr. NF-κB activation was determined by the dual luciferase assay. Data represent mean ± SD (n = 3). **P< 0.01. (F and G) HUVECs prepared as described in C were stained with FITC annexin V and the percent of stained cells is shown (F). Telomere length was determined by using the TL PNA kit (G). Data represent mean ± SD (n = 3). **P < 0.01. (H). Equal amounts of protein from the same cell extracts from each condition were also analyzed by Western blotting for NOX2 levels to show the efficacy of the siRNA on its target molecule level.
