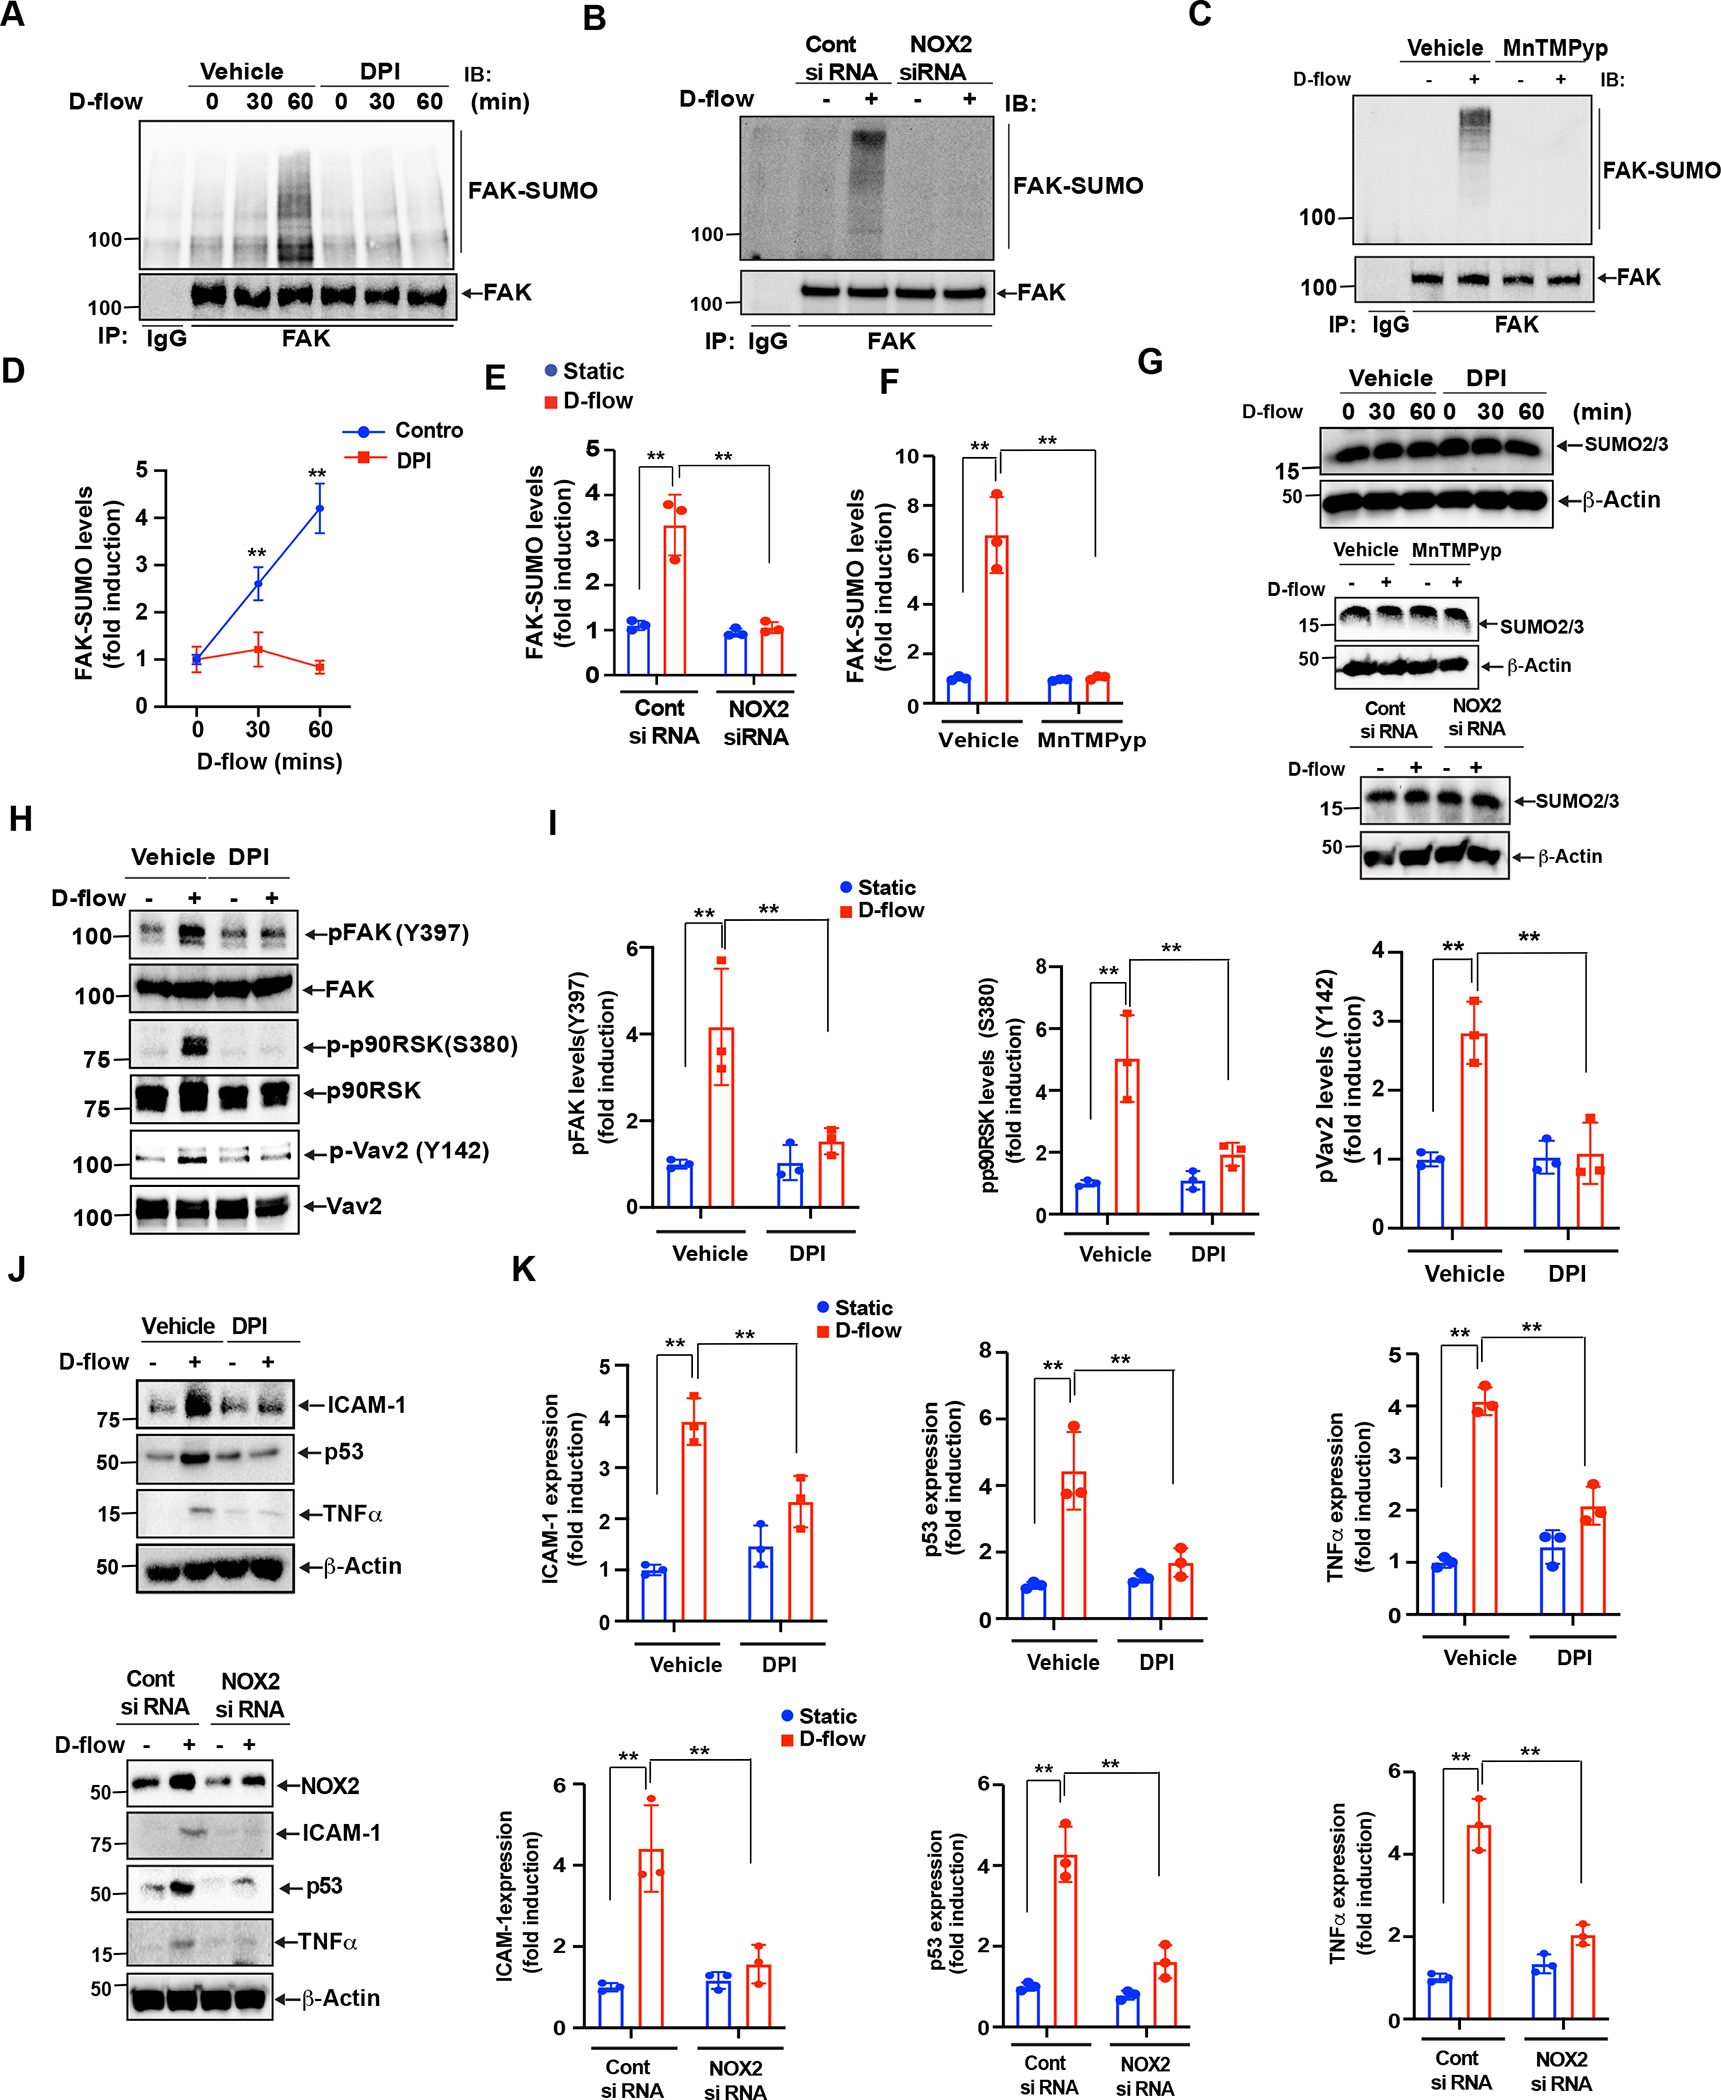
Figure 6: Vav2 role in Nox2 dependent ROS production mediated p90RSK-FAK positive inflammatory feedback loop.

(A, B). HUVECs were pretreated with either DMSO (vehicle) or DPI (10 μM) for 1 hr followed by D-flow stimulation for the indicated times. FAK SUMOylation was detected by immunoprecipitation with anti-FAK or IgG as a control followed by Western blotting with anti-SUMO2/3. The blot was sequentially reprobed for FAK for normalization. The blots are representative data from 3 independent experiments. Quantification of FAK SUMOylation levels is shown after normalization by the total protein levels. Data represent mean ± SD (n = 3–4). **P<0.01 (B). (C-G) Cells were pretreated with 10 μM MnTMPyp for 1hr or transfected with siRNA to knock down NOX2 (100 nm). After that cells were exposed with D-flow for 60 min and cell extracts were prepared. An equal amount of protein from control and each treatment was immunoprecipitated with anti-FAK or anti IgG and the immunocomplexes were immunoblotted with anti-SUMO2/3 antibody. The blots were sequentially reprobed with anti-FAK antibody to show normalization, lane loading control. (G). Equal amounts of protein from the same cell extracts were also analyzed by Western blotting for SUMO2/3, to show the expression of SUMO2/3 and normalized to β-actin. (E-F) shows densitometric quantification of FAK SUMOylation, which was normalized by total FAK protein levels. Data represent mean ± SD, n = 3, **P < 0.01. (H, I) (H). HUVECs were pretreated with either vehicle or DPI for 1 h followed by D-flow stimulation for 1 hour and cell extracts were analyzed by Western blotting for phospho-FAK, phospho-p90RSK and phospho-Vav2 using phosphorylation-specific antibodies against these proteins. The blots were reprobed with anti-FAK, anti-p90RSK and anti-Vav2 to show the total protein expression and to also normalize phosphorylation levels. The blots are representative data from 3 independent experiments. Quantification by densitometry of phosphorylation levels of FAK, p90RSK and Vav2. Data represent mean ± SD (n = 3). **P < 0.01. (I). (J, K) (J) HUVECs were pretreated with DPI for 1 hr or transfected with siRNA to knock down Nox2 and then stimulated by D-flow or no flow for 24 hr. ICAM-1, TNF-α, and p53 expression detected by Western blotting is shown. Blots were reprobed with anti-β-actin antibody to show loading controls. was used as loading control. The blots are representative data from 3 independent experiments. (K) Densitometry was used to quantify ICAM-1, TNF-α, and p53 expression levels. Data represent mean ± SD(n = 3). **P < 0.01.
