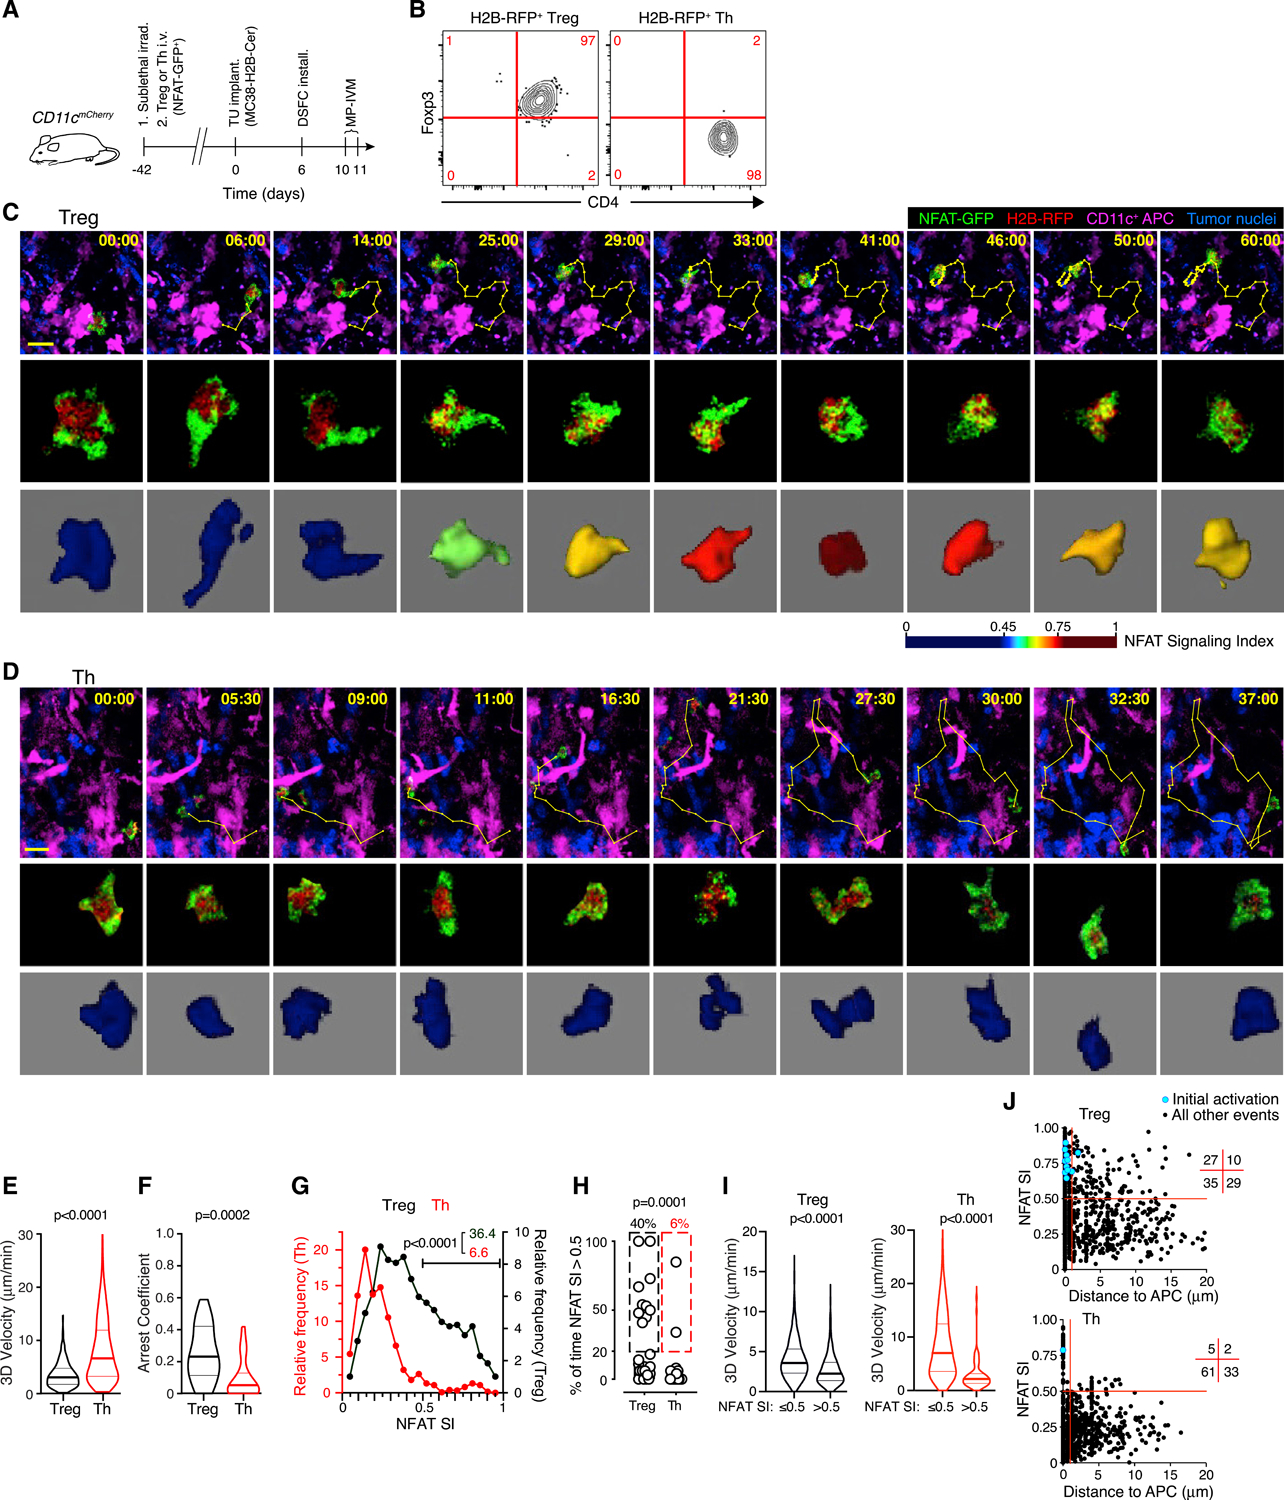
Figure 1. The polyclonal TCR repertoire of Treg cells is enriched for tumor reactivity.

(A) Experimental protocol.
(B) Phenotype of adoptively transferred T cells in the TME.
(C and D) MP-IVM micrographs (top panels) and individual cell images (middle panels) depicting the nucleo-cytoplasmic distribution of NFAT-GFP in an exemplary Treg (C) and Th cell (D) in the TME. Bottom panels show false-color representations of the NFAT signaling index (SI) (see Figures S1F–S1L for details). Numbers indicate min:s. Migratory tracks indicate 1-min intervals. Scale bars, 20 μm.
(E–G) 3D-instantaneous migratory velocities (E), arrest coefficient (F), and instantaneous NFAT SI frequency distribution (G) of Treg (n = 1,088 from 25 cells) and Th cells (n = 1,213 from 31 cells) from 3 individual movies each recorded in 2 independent experiments. Numbers in (G) refer to percentages of NFAT SI >0.5.
(H) Fraction of time in which NFAT SI >0.5 in individual cell tracks. Values above graphs refer to frequencies of cells in which NFAT >0.5 for greater than 20% of time.
(I) Instantaneous cell velocities with NFAT inactive (NFAT SI ≤0.5) or active (NFAT SI >0.5).
(J) Instantaneous NFAT SI as a function of distance to nearest APC. Numbers in grid indicate quadrant frequencies. Light blue symbols indicate instances of NFAT activation following a state of inactivity. p values calculated by Mann-Whitney U test.
