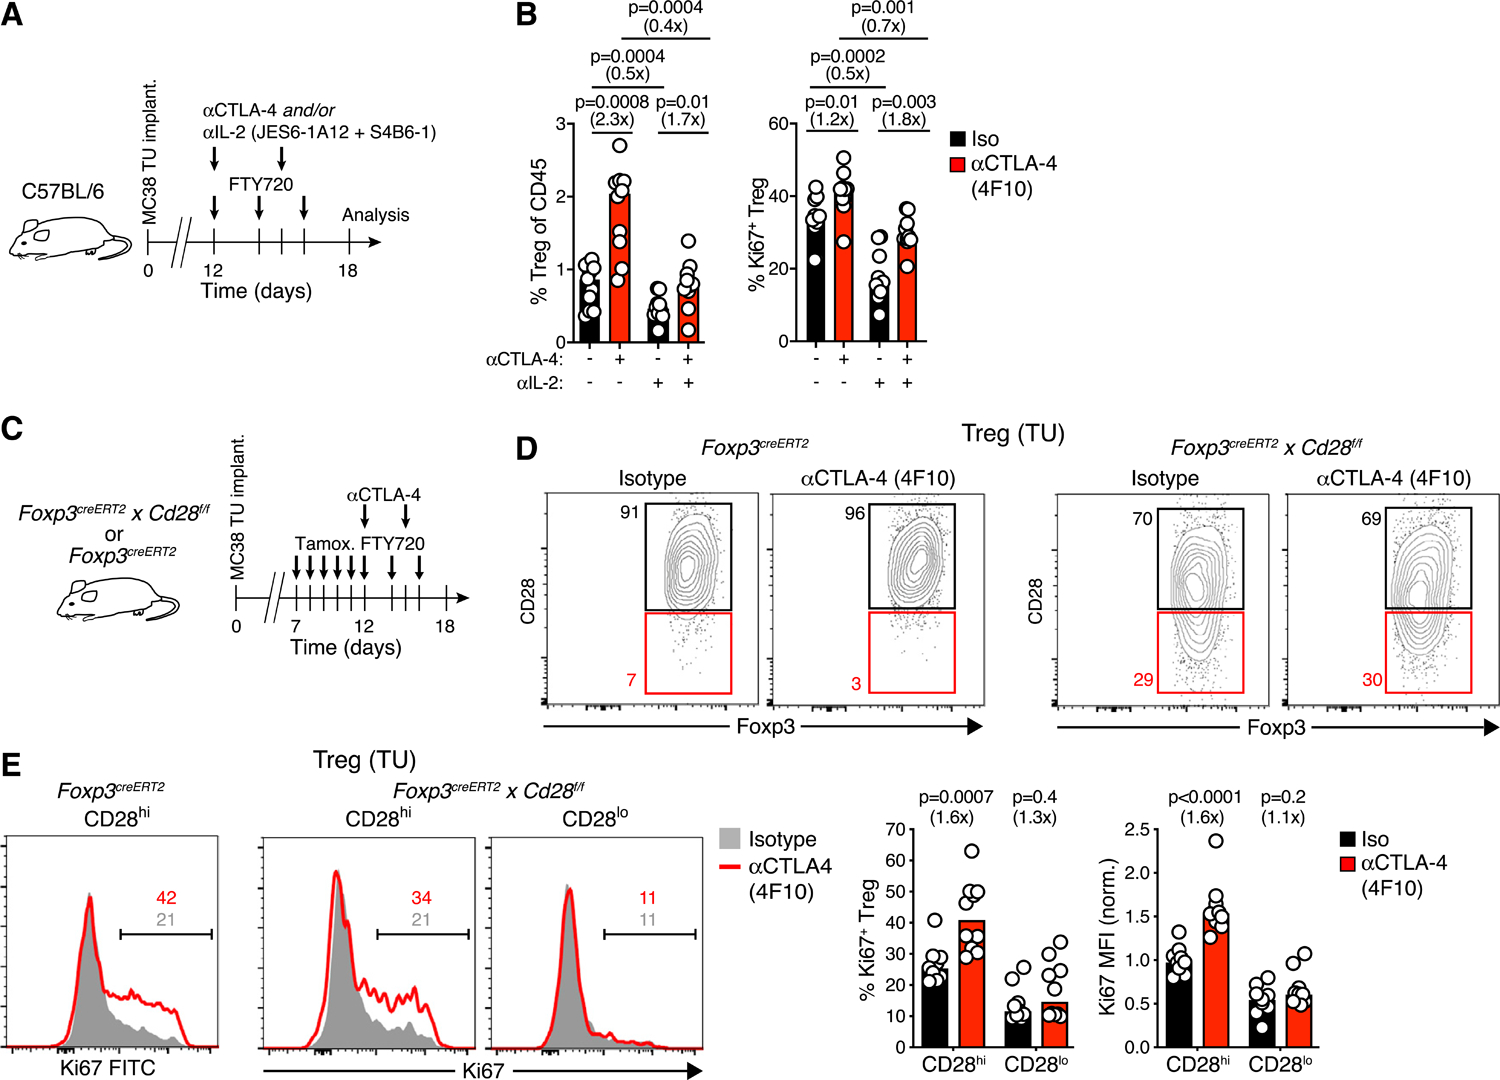
Figure 6. CTLA-4 blockade expands tumor-associated Treg cells through enhanced CD28 co-stimulation.

(A) Experimental protocol.
(B) Frequency of tumor-associated Treg and of Ki67+ Treg cells after blockade of CTLA-4 and/or IL-2. n = 10–11 per group in two independent experiments.
(C) Experimental protocol.
(D) Tamoxifen-induced downregulation of CD28 on Treg cells in the TME of Foxp3creERT2 control (left) or Foxp3creERT2 × CD28f/f (right) mice treated with αCTLA-4 (4F10) or isotype mAbs. Gates defining CD28lo cells are based on CD28 expression in Foxp3creERT2 control animals.
(E) Ki67 expression in CD28hi and CD28lo Treg cells in Foxp3creERT2 control (left, no CD28lo cells detected) or Foxp3creERT2 × CD28f/f mice (right) following αCTLA-4 or isotype mAb treatment. Numbers depict cell percentages. Bars represent medians, each symbol represents an animal. Fold change as compared to control groups indicated in parentheses. MFI normalized to the mean of controls; p values calculated by Mann-Whitney U test.
See also Figure S7.
