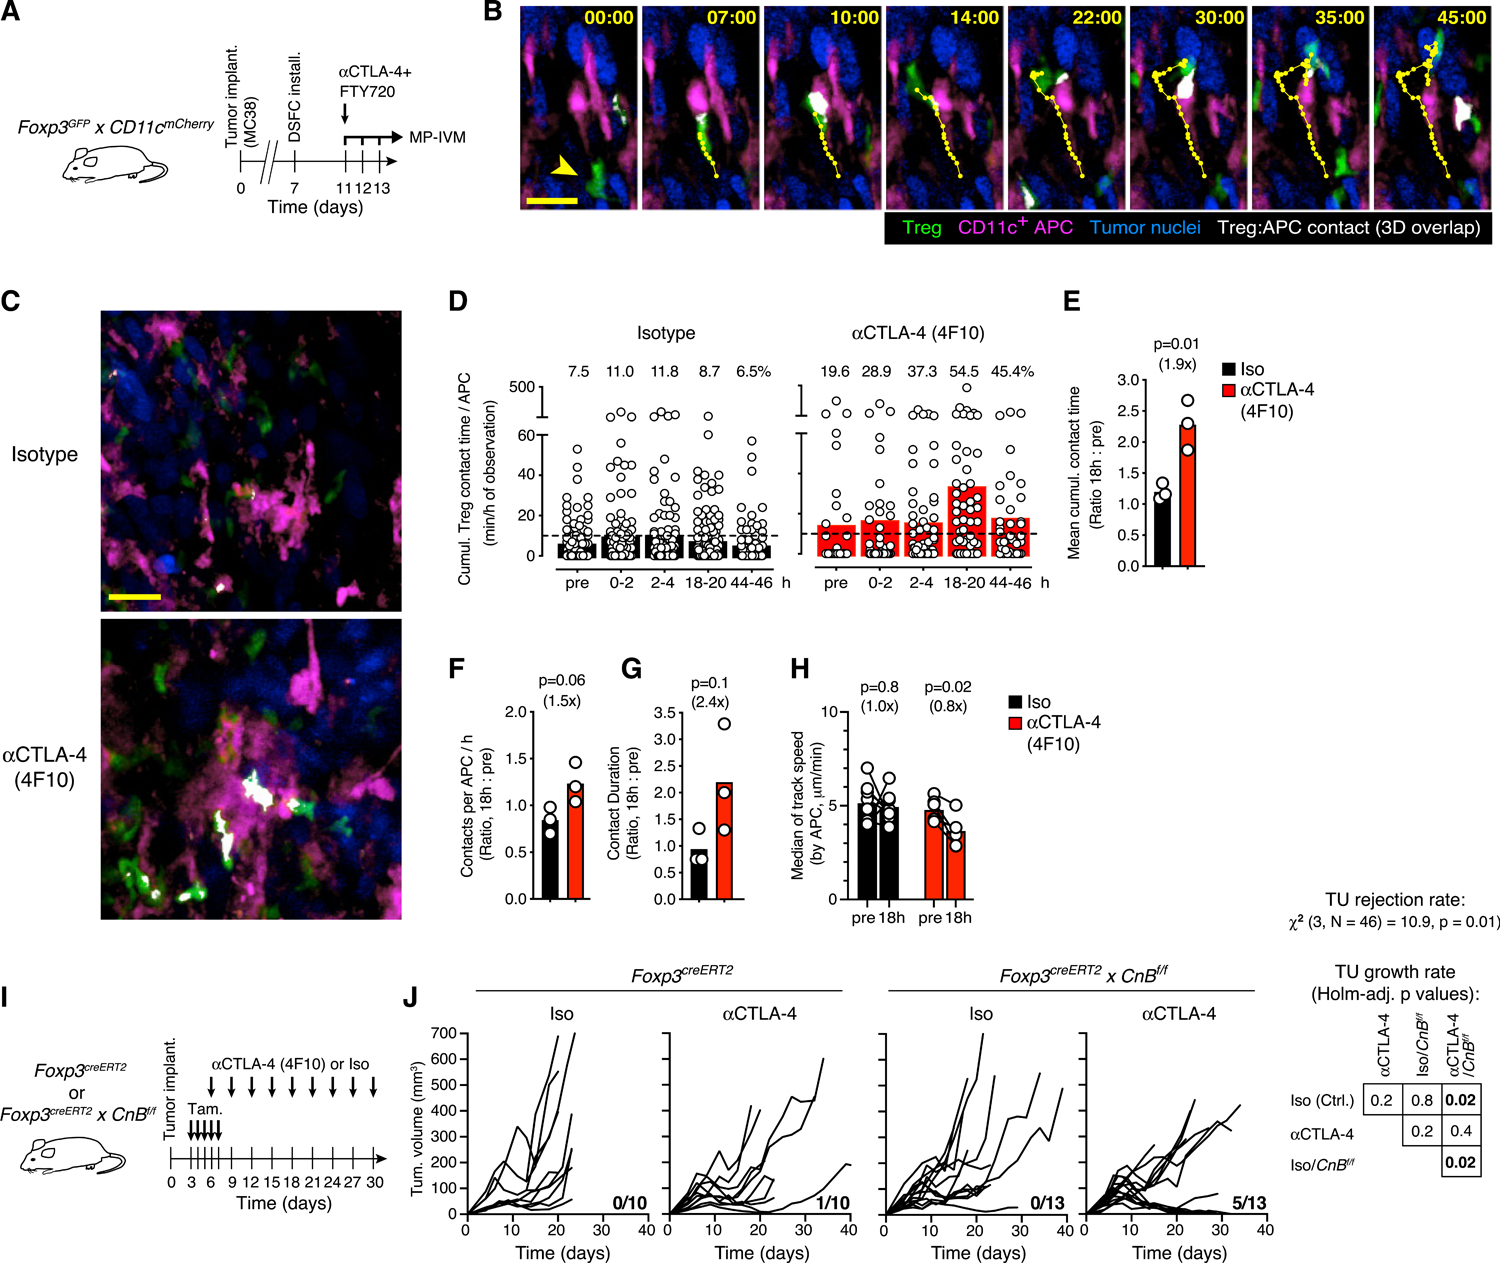
Figure 7. Treg cells limit the therapeutic efficacy of CBI even when their CTLA-4-dependent function is disabled.

(A) Experimental protocol.
(B) MP-IVM micrographs illustrating the dynamic physical contact zone (white) between a Treg cell (green, arrowhead in first frame) and a CD11c+ APC (magenta) in the TME, as determined by their overlapping fluorescent signals. Numbers indicate min:s. Migratory tracks indicate 1-min intervals. Scale bar, 20 μm.
(C) MP-IVM micrographs recorded 18 h after αCTLA-4 4F10 or isotype control mAb treatment. Note increased Treg cell-APC contacts (white) upon CTLA-4 blockade. Scale bar, 50 μm.
(D) Cumulative Treg cell contact time per hour for individual APCs in the same region of interest of the tumor at various time points. Symbols represent individual APCs and bars means. Numbers above graphs indicate percentages of APCs interacting with Treg cells for >10 min (dashed line) per hour.
(E–G) Ratios of mean cumulative Treg cell contact time per APC (E) mean number of Treg cell contacts per APC (F) and median Treg cell-APC contact duration (G) between 18 h after and before injection of either αCTLA-4 or isotype mAbs. Bars depict means, symbols individual experiments. p value calculated by Student’s t test.
(H) Median track speed of Treg cells within a 20 μm radius of selected APCs identifiable before and 18 h after αCTLA-4 (n = 6) or isotype mAbs (n = 8) administration. Bars represent means, paired symbols individual areas. p values calculated by ratio paired Student’s t test. In (E) to (H), numbers in parentheses represent the fold change from the control group.
(I) Experimental protocol.
(J) Growth curves of MC38 tumors upon 4F10-mediated blockade of CTLA-4 and/or Treg cell-specific deletion of CnB. n = 10–13 per group. The fraction of mice that rejected tumors is indicated in each graph (pooled from three independent experiments). The rates of tumor rejection were compared using χ2 test. Tumor growth rates were compared using type II ANOVA followed by Holm-corrected pairwise comparisons. Table shows Holm-adjusted p values.
