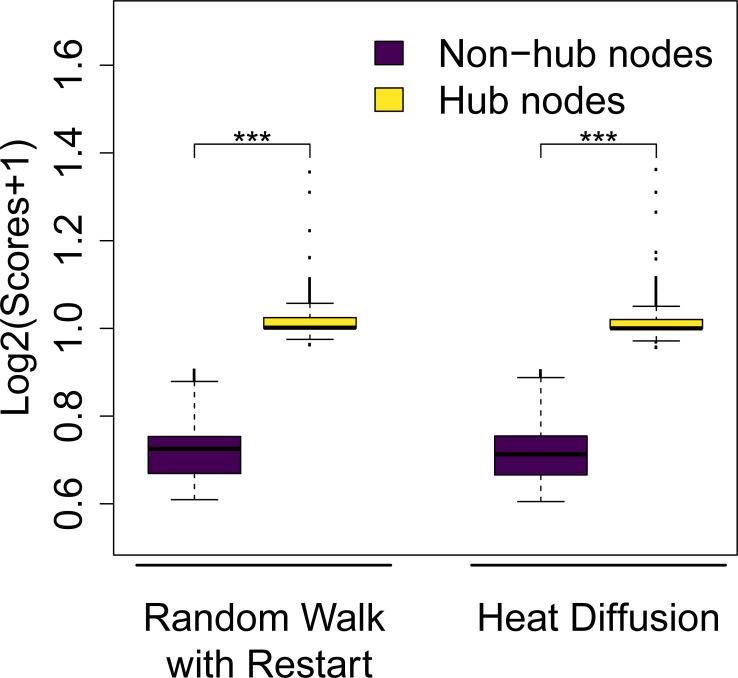
Fig 1. Normalized Laplacian induces a topology bias.
Distributions of log-transformed node scores after network propagation using the normalized Laplacian ( and t = 0.7 for Heat Diffusion, and and α = 0.5 for Random Walk with Restart). The input vector was a unit vector, i.e. all nodes had identical initial scores. Hub nodes (top 10% nodes with the highest degree) gain higher average scores, whereas non-hub nodes (bottom 10% nodes with the lowest degree) get lower average scores (Two-sided Wilcoxon rank sum test p-value < 2.2∙10−16 (***)).

