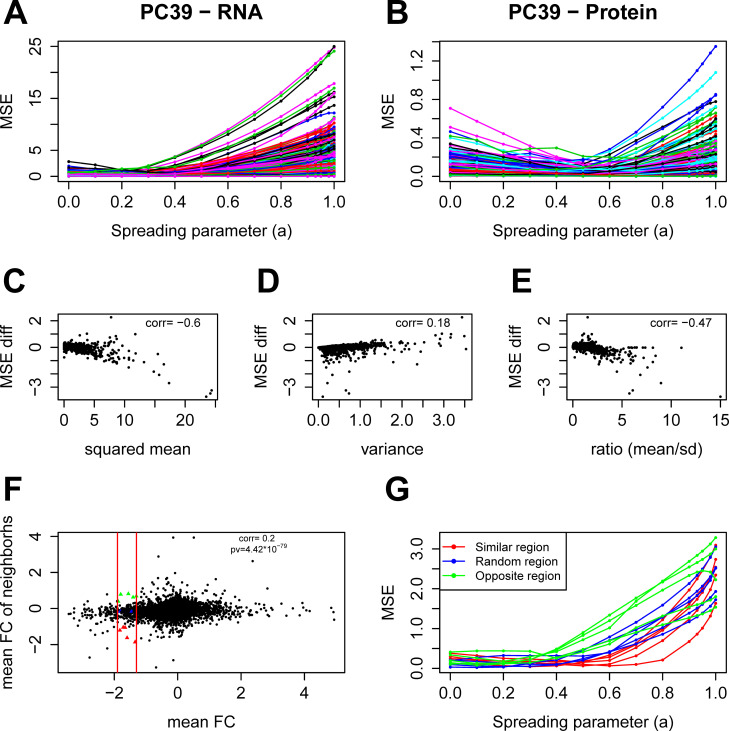
Fig 3. Factors affecting network propagation gain of individual genes.
A, B: MSE curves of individual genes for the mRNA (A) and protein (B) layer of the PCa study using RWR. C, D, E: Impact of network propagation on gene-specific MSEs. The panels show the change of the MSE (MSE difference comparing value at α = 0 and α = 0.4) versus the corresponding (squared) mean log2 fold changes (C), versus the inter-replicate variance (D), and versus the corresponding ratios (mean in absolute/SD) (E) for the mRNA layer. The correlation coefficient is given in all three panels. F: Average log2 fold change of the genes’ neighbors versus their own fold changes for the mRNA layer. The correlation coefficient and corresponding p-value are given. The two vertical red lines have abscissa (-1.9) and (-1.3). Colored points within this area have been selected to generate MSE curves in (G). G: MSE curves of the colored points in (F). The genes were selected to have similar mean log2 fold changes to eliminate the effect of the mean value. Red curves correspond to genes with similar mean value neighbors, blue correspond to genes in a random neighborhood and green to genes with opposite sign mean value neighbors. Genes with informative neighbors (red curves) achieved lower MSEs after network propagation compared to other genes (blue and green curves).

