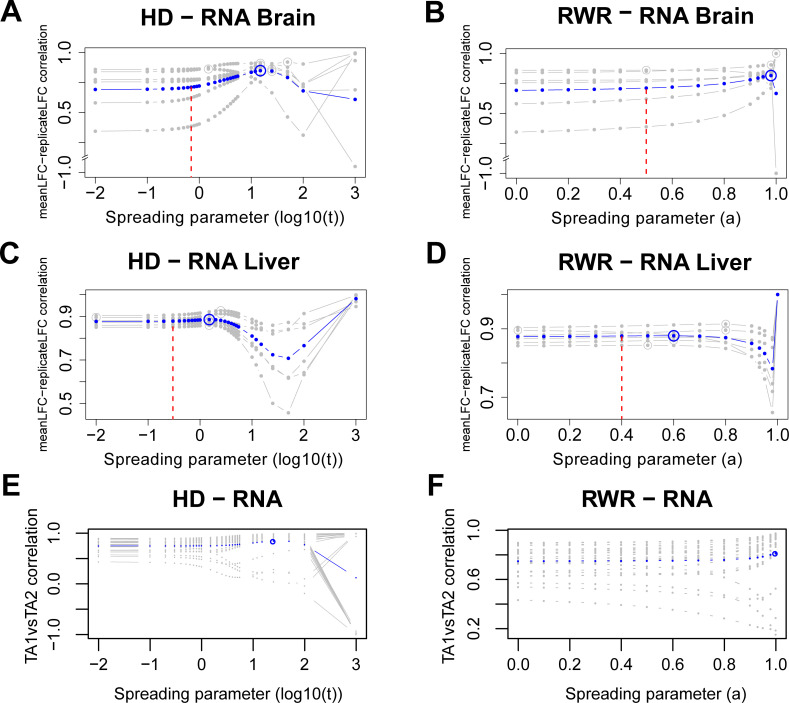
Fig 4. Inter-replicate consistency and within-patient similarity across network smoothing.
Correlation of replicate-wise propagated log2 fold changes with propagated average log2 fold changes of the transcriptome for the brain (A, B) and liver (C, D) using HD (A, C) and RWR (B, D). Gray lines are correlations of individual replicates with the average fold changes obtained by combining all replicates. Blue lines are averaged correlations across replicates at the respective spreading parameters for HD and RWR. Maximum correlations are circled (gray and blue). The vertical dashed red lines denote the optimal spreading parameters from the between-dataset analysis (i.e. comparing mRNA and protein propagated scores; see Fig 5). E, F: Correlations between propagated mRNA log2 fold changes of TA1 and corresponding propagated mRNA log2 fold changes of paired TA2 across the values of the spreading parameter for the 25 PCa patients with HD (E) and RWR (F). Each gray curve corresponds to a patient while the average curve is depicted in blue. Average maximal correlations are circled. For computing the correlation, only measured network nodes within each dataset were used.

