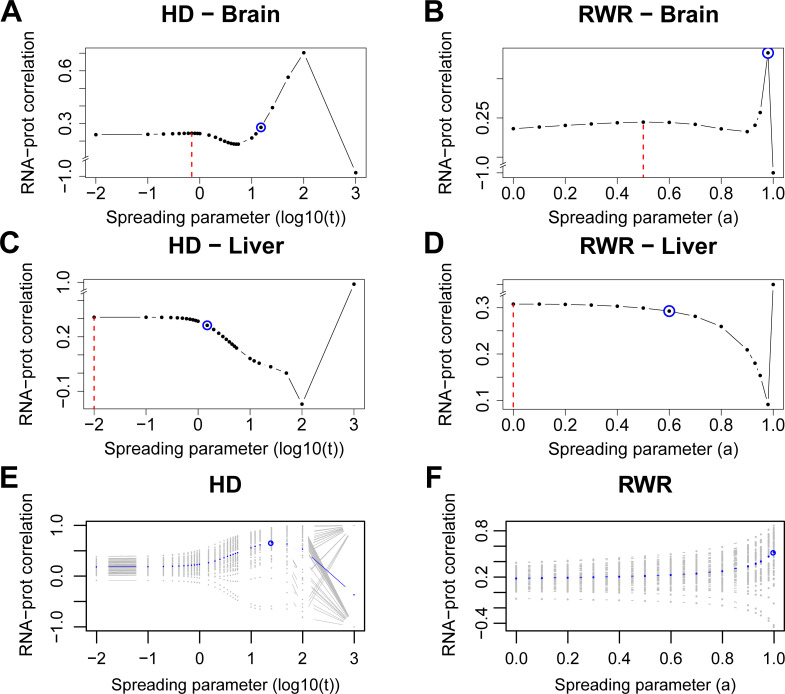
Fig 5. Network propagation improves the correlation between mRNA and protein levels of ageing tissues (brain and liver) and PCa samples.
A, B: correlations between propagated scores from mRNA log2 fold changes and protein weighted mean log2 fold changes from old brain samples with varying spreading coefficients for HD (A) and RWR (B). C, D: Correlations of propagated scores from mRNA and protein log2 fold changes of liver samples with HD (C) and RWR (D). Dashed red lines: local maximal correlations from the between-dataset consistency analysis. Blue circles: average maximal correlations from the within-dataset consistency analysis. E, F: Correlations between propagated mRNA log2 fold changes and corresponding propagated protein log2 fold changes across the values of the spreading parameter for the 63 PCa tumor samples with HD (E) and RWR (F). Each gray curve corresponds to a tumor sample while the ‘average’ curve is depicted in blue. Average maximal correlations are circled. Correlations were calculated using genes that were expressed and quantified with both RNA-Sequencing and MS proteomics as well as present in the functional interaction network (n = 1,772 genes for brain, n = 1,670 for liver, n = 1,828 for PCa).

