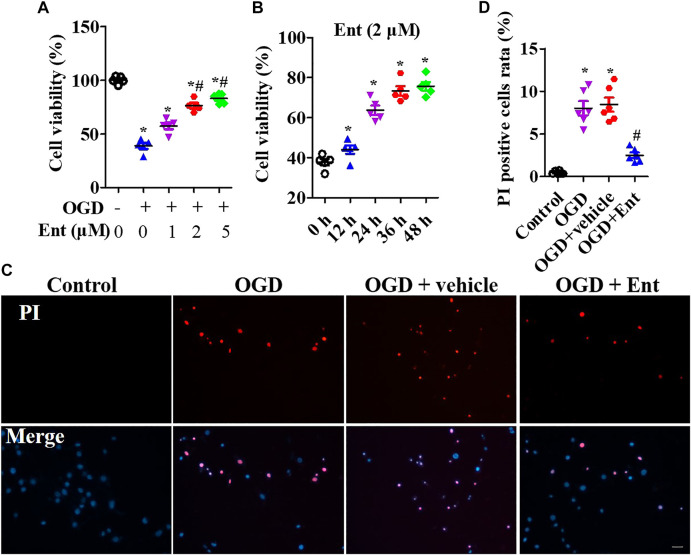
FIGURE 5.
Entinostat suppresses OGD-induced neuronal injury. In the OGD-induced neuronal damage model, cell viability was measured after being treated with 0, 1, 2, or 5 μM entinostat for 24 h (A) or treated with 2 μM entinostat for 12, 24, 36, or 48 h (B). (C) PI staining of primal neurons at 24 h after being treated with 2 μM entinostat, and DAPI stained all cell nuclei. (D) Histogram analysis of PI-positive cells. Scale bars: 50 μm. Data are expressed as the mean ± SEM, n = 4. *p < 0.05, vs. the control group; #p < 0.05, vs. the OGD group.

