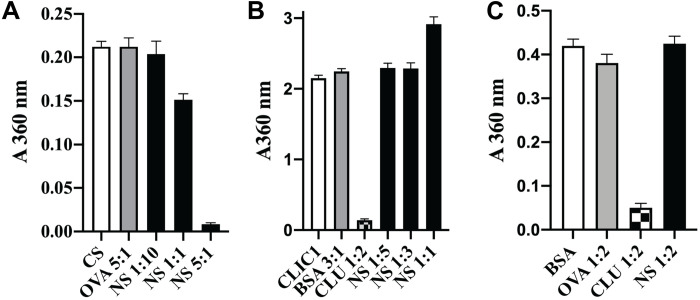
Fig. 3. NS has limited ability to inhibit amorphous protein aggregation.
(A to C) Histograms showing the endpoint absorbance values (A360 nm), which were used to measure the amorphous aggregation of CS (A), CLIC1 (B), and BSA (C). See fig. S2 for the corresponding complete protein aggregation assay time courses. Nonchaperone control proteins (OVA, BSA, and SOD) and the molar ratio of these, CLU or NS to the aggregating protein, are indicated on the respective plots. Data points plotted are means ± SEM (n = 3), and each result shown is representative of two independent experiments.

