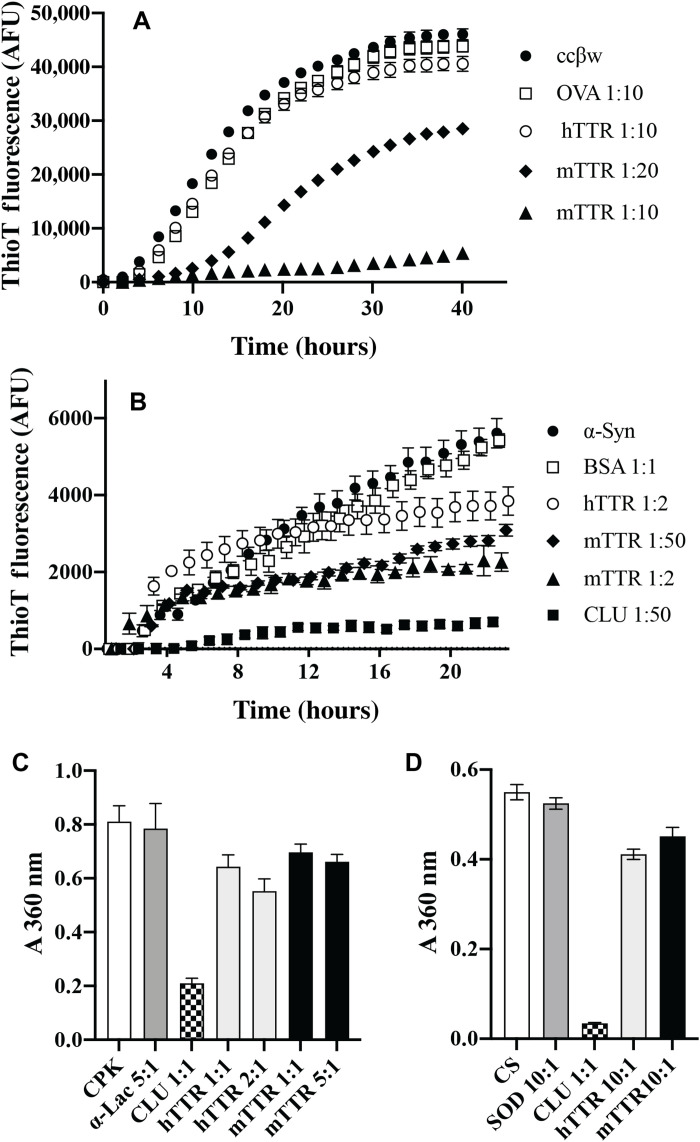
Fig. 5. TTR inhibits amyloid formation but has limited effects on amorphous protein aggregation.
(A and B) Plots of ThioT fluorescence (AFU) as a function of time for aggregation reactions containing (A) ccβω and (B) α-syn. Nonchaperone control proteins (OVA and BSA) and the molar ratio of these or hTTR/mTTR to the aggregating protein are indicated in the respective keys. (C and D) Histogram plots showing absorbance values (A360 nm) used to quantify the amorphous aggregation of CPK (at 5 hours) (C) and CS (at 1.5 hours) (D). See fig. S5 for the corresponding complete aggregation time courses. Nonchaperone control proteins (α-lac and SOD) and the molar ratio of these, CLU or hTTR/mTTR to the aggregating protein, are indicated on the respective plots. For (A) to (D), data points plotted are means ± SEM (n = 3), and each result shown is representative of two independent experiments. In some cases, the error bars are too small to be visible.

