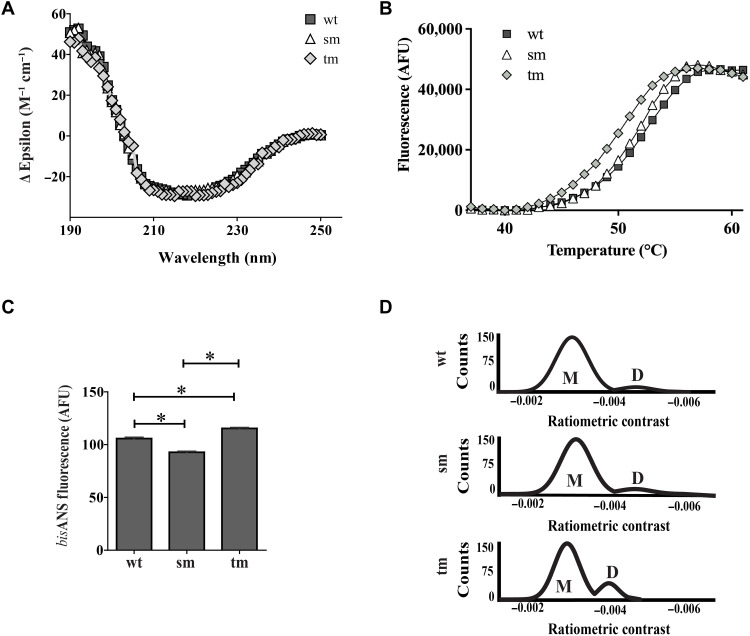
Fig. 6. Biophysical characterization of wild-type NS and mutants.
(A) Far UV CD spectra of NSwt (wt), NSsm (sm), and NStm (tm), plotted as mean residue ellipticity against wavelength at 37°C. Means ± SEM (n = 10) are plotted. (B) Results of a thermal shift assay, measuring SPYRO Orange fluorescence (AFU) as a function of temperature for NSwt (wt), NSsm (sm), and NStm (tm). Means ± SEM (n = 4) are plotted. For (A) and (B), each result is representative of at least two independent experiments and the error bars are too small to be visible. (C) BisANS analysis of wt, sm, and tm NS. Mean fluorescence values (AFU) ± SEM (n = 3) are plotted; error bars are too small to be easily seen. Asterisks indicate statistically significant differences (Student’s t test, pairwise comparisons, P < 0.05). Results are representative of three independent experiments. (D) Mass photometry analyses showing the distribution of putative monomeric (M) and dimeric (D) forms of wt, sm, and tm NS. Results are representative of three independent experiments.

