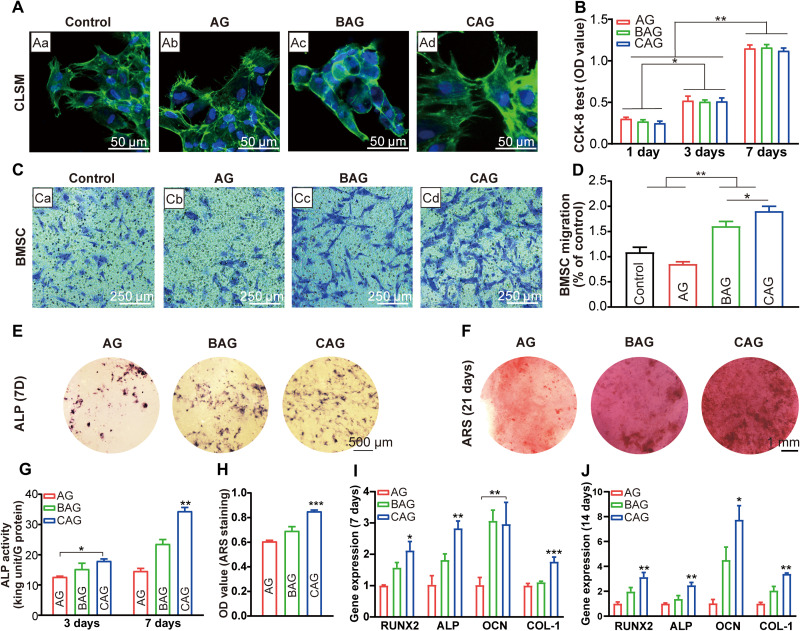
Fig. 6. Osteogenic differentiation of BMSCs cultured on hydrogels.
(A) Confocal laser scanning microscopy (CLSM) images of cells cultured for 24 hours [(a), control, (b) AG, (c) BAG, and (d) CAG]. (B) Cell Counting kit-8 (CCK-8) assay of cells cultured for 1, 3, and 7 days. **P < 0.01, ***P < 0.001. (C) Migration of BMSCs in the transwell assay. (Ca) Control, (Cb) AG, (Cc) BAG, and (Cd) CAG. (D) Number of migrated BMSCs normalized to control group. (E) Alkaline phosphatase (ALP) staining of cells cultured for 7 days. Images of (E) exhibit the same scale bar of 500 μm. (F) Alizarin red staining (ARS) of cells cultured for 21 days. Images of (F) exhibit the same scale bar of 1 mm. (G) ALP activity of cells cultured for 3 and 7 days. (H) Quantitative analysis of cell mineralization for 21 days. (I and J) Osteogenic gene expression of BMSCs cultured with different hydrogels for 7 days (I) and 14 days (J). Note: Runt-related transcription factor 2 (RUNX2), ALP activity, collagen type I (COL-1), and osteocalcin (OCN). Osteogenic gene expression of cells cultured on AG served as a calibrator. * indicates statistically significant difference (P < 0.05) between groups.

